Download

1 / 13
130 likes | 226 Views
Gain insights into the in-depth analysis and methodology behind Securities Class Action (SCA) claims, crucial for refining traditional approaches. Learn how estimate strengths, policy profiles, and exposure to loss are calculated to assess ultimate value. Discover trends, case filings, and settlements impacting securities litigation.

E N D
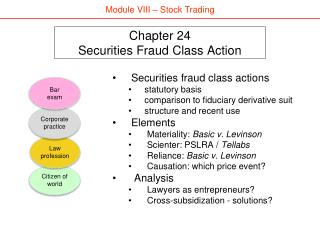
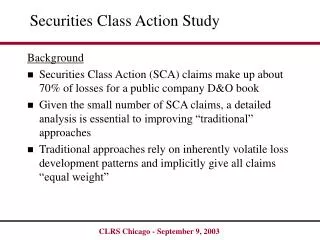
Securities Class Action Study Background • Securities Class Action (SCA) claims make up about 70% of losses for a public company D&O book • Given the small number of SCA claims, a detailed analysis is essential to improving “traditional” approaches • Traditional approaches rely on inherently volatile loss development patterns and implicitly give all claims “equal weight”
Securities Class Action Study Methodology • SCA claims are independently identified by daily reviews of the Stanford and PWC websites • Potential claims, in some instances, are identified before clients give notice • The Claims Department estimates the expected loss amount and assigns an estimate strength • Estimate strengths are closed, “strong”, “weak”, or “none” (i.e. not enough info available to assess)
Securities Class Action Study Methodology • Strong or closed claim estimates are considered accurate assessments of ultimate value • For weak or no estimate claims, older years’ estimates are extrapolated using a 12.5% trend per year • Each claim’s limit, attachment point and SIR (the policy profile) are factored in • To account for the policy profile by claim, the ILF curve underlying the cessions factors is used to calculate a relative exposure to loss (REX)
Securities Class Action Study Methodology • For example, Low Att. Pt. Inc. and Higher Att. Pt. Inc. are both SCA’s during 2002: • In the case above, Lower Att. Pt. Inc. is 40% riskier than Higher Att. Pt. Inc. (1.09/0.78 – 1), all else being equal
Securities Class Action Study Methodology • This calculation is applied to each claim for each year. For instance, for the immature accident year, the average REX, reflecting that year’s policies’ profiles, is 1.03 • Since the REX builds in 12.5% per year ground-up severity trend, the 0.99 REX for the mature AY shows a large movement away from loss • To derive the estimated severity for those claims deemed weak or no estimates, the REX of the W/N claims is compared to the REX from a prior year (e.g. immature AY):
Securities Class Action Study Methodology • The same approach is applied to derive estimated severities by bringing other accident years forward • The final selected immature severity is a weighted average of the severities from the mature years • Non-class action ultimates are derived using a conventional frequency/severity method
Revealing Headlines? "2001 was a year to forget for many investors ...resulted in an all-time high of 487 securities class action filings in 2001, a 105% increase from 2000…..” -Risk and Insurance, March 1, 2002 Thirty-One Percent More Securities Class Action Suits Filed in 2002 Than in 2001 “Federal securities class action litigation suits increased by 31 percent between 2001 and 2002, rising from 171 to 224 filings.” -Stanford Law School, Cornerstone Research March 13, 2003
Analyst Cases 262 262 172 317 Analyst Cases IPO Laddering Cases Cost of IPO Claims 22 55 22 55 39 227 227 40 40 219 219 172 39 227 Post PSLRA Securities Class Action Frequency 489 39 266 241 * *Extrapolated – from www.securities.stanford.edu
Revealing Headlines? "2001 was a year to forget for many investors ...resulted in an all-time high of 487 securities class action filings in 2001, a 105% increase from 2000…..” -Risk and Insurance, March 1, 2002 Federal Securities Class Action Cases Filed and Defendant Market Cap Losses Surge in 2001 -Stanford Law School, Cornerstone Research March 15, 2002 "average settlements have increased from $7.8 million for pre-PSLRA cases to $24.9 million for post-PSLRA cases…..” -Policy Limitations on Coverage, by John E. Black Jr. and Ellen D. Jenkins - April 2003 Thirty-One Percent More Securities Class Action Suits Filed in 2002 Than in 2001 “Federal securities class action litigation suits increased by 31 percent between 2001 and 2002, rising from 171 to 224 filings.” -Stanford Law School, Cornerstone Research March 13, 2003
Analysis of Settlements • Headlines and average settlements continue to be driven by a handful of cases each year • These “mega” cases are trending materially higher, but are 5% of the cases • The remaining 95% of all cases have single to low double-digit trend over the last five years