Download
1 / 3
30 likes | 137 Views
Report on UBC run results including sequence homology graph construction, clustering statistics, and cluster size distribution represented as a histogram. The process involved preprocessing with suffix trees, building the homology graph, and performing clustering using Louvian code.

E N D
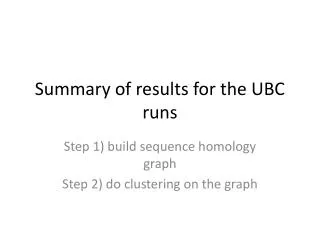
Summary of results for the UBC runs Step 1) build sequence homology graph Step 2) do clustering on the graph
Clustering output statistics Distribution of clusters by size (histogram) X-axis denotes cluster size bins (e.g., bin “64” shows that 22,444 clusters had size between 33 and 64) Y-axis denotes the number of clusters within each bin.
Performance statistics Step 0) preprocessing usingsuffix trees Step 1) building the homology graph Step 2) clustering was performed using Louvian code