Download
1 / 1
10 likes | 129 Views
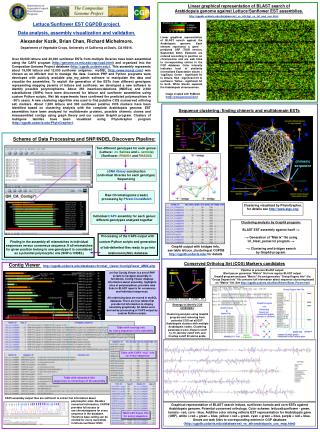
This research presents a linear graphical representation of a BLAST search comparing the Arabidopsis genome against lettuce and sunflower EST assemblies. Conducted by the Department of Vegetable Crops at UC Davis, the study comprises over 60,000 lettuce and 40,000 sunflower ESTs, which have been organized into the Compositae Genome Project database. The graphical representation allows for visualization of gene similarity, with color coding based on significant hits. The study reports the identification of SNPs and INDELs, along with putative conserved ortholog set markers, vital for exploring genetic variations.

E N D
Linear graphical representation of BLAST search of Arabidopsis genome against Lettuce/Sunflower EST assemblies. http://cgpdb.ucdavis.edu/database/est_vs_ath/tigr_vs_let_and_sun.html Lettuce/Sunflower EST CGPDB project. Data analysis, assembly visualization and validation. Alexander Kozik, Brian Chan, Richard Michelmore. Department of Vegetable Crops, University of California at Davis, CA 95616. Linear graphical representation of BLAST search against the Arabidopsis genome. Each element represents a 'gene' - predicted ORF (TIGR version, September 2002). Elements are ordered according to position on chromosome and are web links to corresponding entries in the CGP database. Color intensity indicates level of similarity (normalized Expectation values = -log(Exp)). Green - significant hit to lettuce, Red - significant hit to sunflower. Yellow - significant hit to both. White blocks separate the Arabidopsis chromosomes. Over 60,000 lettuce and 40,000 sunflower ESTs from multiple libraries have been assembled using the CAP3 program (http://genome.cs.mtu.edu/cap/cap3.html) and organized into the Compositae Genome Project database (http://cgpdb.ucdavis.edu/). This assembly represents about 19,000 lettuce and 12,000 sunflower unigenes. mySQL (http://www.mysql.com/) was chosen as an efficient tool to manage the data. Custom PHP and Python programs were developed with publicly available php_my_admin software to manipulate the data and visualize the assemblies. To exploit the generation of the ESTs from different genotypes representing mapping parents of lettuce and sunflower, we developed a new software to identify possible polymorphisms. About 250 insertions/deletions (INDELs) and 2,500 substitutions (SNPs) have been discovered for lettuce and sunflower assemblies using custom Python scripts. Wet lab experiments have confirmed the predicted polymorphism in ~90% cases. A new clustering algorithm was used to find putative COS (conserved ortholog set) markers. About 1,200 lettuce and 500 sunflower putative COS markers have been identified based on clustering analysis with the complete Arabidopsis genome. EST assemblies have been analyzed for multidomain proteins, possible chimeric clones and misassembled contigs using graph theory and our custom Graph9 program. Clusters of multigene families have been visualized using PhyloGrapher program (http://cgpdb.ucdavis.edu/PhyloGrapher/). Image created with PyMood (http://www.pymood.com/) Sequence clustering: finding chimeric and multidomain ESTs Scheme of Data Processing and SNP/INDEL Discovery Pipeline: Two different genotypes for each genus: (Lettuce: cv. Salinas and L. serriola) (Sunflower: RHA801 and RHA280) chimeric sequence cDNA library construction (individual libraries for each genotype) Sequencing Raw Chromatograms (reads) processing by Phred-CrossMatch Clustering visualized by PhyloGrapher, for details see http://www.atgc.org/ Individual CAP3 assembly for each genus: different genotypes analyzed together Clustering analysis by Graph9 program: BLAST EST assembly against itself --> -->Generation of "Matrix" file using tcl_blast_parser.tcl program --> -->Clustering and bridges search by Graph9 program. Processing of the CAP3 output with custom Python scripts and generation of tab-delimited files ready to go into relational mySQL database Finding in the assembly all mismatches in individual sequences versus consensus sequence. If all mismatches for given position belong to one genotype it is considered as a potential polymorphic site (SNP or INDEL) Graph9 output with bridges info, see table lettuce_clustering at CGPDB http://cgpdb.ucdavis.edu/ for details Conserved Ortholog Set (COS) Markers candidates Contig Viewer http://cgpdb.ucdavis.edu/database/chromat_viewer/ContigViewer_MMX.php Pipeline to process BLAST output: Blast parser generates "Matrix" file form regular BLAST output. Graph9 program analyzes "Matrix" file and generates "Group Degree Info" file. "Group Degree Info" file contains full information about sequence clustering based on "Matrix" file. See http://cgpdb.ucdavis.edu/BlastParser/Blast_Parser.html on-line Contig Viewer is a set of PHP scripts to navigate assembly in full details. Contig Viewer displays information about assembly, highlights sites of polymorphism, provides web links to BLAST reports for consensus and individual sequences. All underlying data are stored in mySQL database. There are four tables that provide full information to display assembly graphically. All tables were derived by processing of CAP3 output by custom Python scripts. Example of false “single” hit Strategy to identify COS candidates: Clustering analysis using Graph9 program and removing from potential COS set all EST-Arabidopsis clusters with multiple Arabidopsis nodes. Clustering parameters were: Expect cutoff 1e-10, Identity cutoff 20% and Overlap cutoff 50 amino acids. Table with overlap info for every sequence in the assembly Table with CAP3 “clip” info for every sequence Table with mismatch info sequences vs consensus of the assembly CAP3 assembly output files are sufficient to extract full information about polymorphic sites. Besides numerical information, CGPDB provides full access to raw chromatograms for every sequence in the database. Therefore base calling can be verified for every nucleotide in lettuce/sunflower ESTs Graphical representation of BLAST search lettuce, sunflower, tomato and corn ESTs against Arabidopsis genome. Potential conserved orthologs. Color scheme: lettuce&sunflower - green, tomato - red, corn - blue. Additive color mixing reflects EST representation for Arabidopsis gene (ORF). white = red + green + blue, yellow = red + green, cyan = green + blue, purple = red + blue. Genes are web links to corresponding entries in CGP database (http://cgpdb.ucdavis.edu/database/est_vs_ath/arabidopsis_cos_map.html) Table with tissue info for every sequence