Download
1 / 26
260 likes | 382 Views
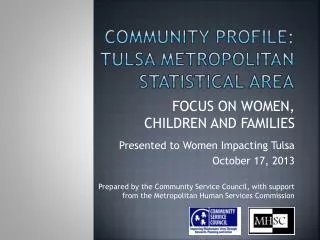
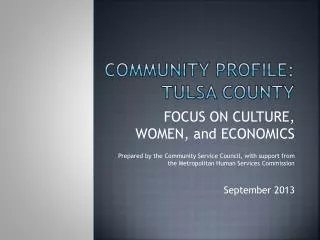
This comprehensive report prepared by the Community Service Council with support from the Metropolitan Human Services Commission presents demographic trends in Tulsa County, focusing on women, culture, and economics. Analyzing population statistics from the US Census Bureau, it highlights significant changes in age, race, marital status, living arrangements, and educational attainment over recent years. Particularly notable is the explosive growth of the Hispanic population and the insights into family dynamics and workforce participation among various demographics. For more details, visit www.csctulsa.org.

E N D
Community Profile: Tulsa County FOCUS ON CULTURE, WOMEN, and ECONOMICS Prepared by the Community Service Council, with support from the Metropolitan Human Services Commission September 2013
Demographic trends Total population Sex Age Race and Hispanic Origin
Distribution of population by age by sex: tulsa county, 2012 Source: US Census Bureau, 2012 Population Estimates.
Family Type for Children under Age 6 by Race and Ethnicity, tulsa county 2010 Source: US Census Bureau, 2010 Census.
Marital status among women age 20 and over: Tulsa county, 2011 Source: US Census Bureau, 2011 American Community Survey.
Life expectancy by sex: U.S., 1900 to 2011, and tulsa county, 2009 Source: US Census Bureau, 2012 Population Estimates.
The aging population in Tulsa County is predominantly female, many live alone and over a third have a disability Source: US Census Bureau, 2011 American Community Survey.
Living arrangements of persons 65 and older: Tulsa county, 2011 3.8% 2.1% 28.7% 65.4% Source: US Census Bureau, 2011 American Community Survey.
Hispanic Population Numeric Change 2000 to 2010 The Hispanic population has experienced explosive growth in both the County and the City since 2000, with increases of 32,966 (+98%) in the County, and 27,155 (+97%) in the City
Distribution of Children Under Age 5 by race and hispanic origin: Tulsa county, 2000 & 2010 +7.9% -14.1% +113.5% -9.3% +57.9% +17.4% +51.7% Source: US Census Bureau, 2000 and 2010 Censuses.
Percentage of 4th graders not proficient in reading by race and hispanic origin: United states: 2011 Source: Annie E. Casey Foundation, “KIDS COUNT Data Book, 2013.”
Geographic Comparison of Educational Attainment, 2008-10: Percentage of Hispanic Population Age 25+ with Associates or Bachelors Degrees or Higher Note: Values shown are midpoint estimates within a 90% confidence range. Values in gray are estimates with margins of error that fall outside of the acceptable range. Prepared by the Community Service Council with support from the Metropolitan Human Services Commission. Source: US Census Bureau, 2008-10 American Community Survey.
Hispanic Population Numeric Change 2000 to 2010 The Hispanic population has experienced explosive growth in both the County and the City since 2000, with increases of 32,966 (+98%) in the County, and 27,155 (+97%) in the City
Educational Attainment by Race & Hispanic Origin, 2006-10: United States and OklahomaPercentage of Population Age 25 and Older with Bachelors Degree or Higher Prepared by the Community Service Council with support from the Metropolitan Human Services Commission. Source: US Census Bureau, 2006-10 American Community Survey (PUMS).
Enrollment in Selected Grades: Tulsa County Public Schools, SYE 2012 Prepared by the Community Service Council with support from the Metropolitan Human Services Commission. Source: Oklahoma State Dept of Education, Oct. 1 2011 Membership Report
Civilian Labor Force Participation Rates among Persons 25 to 54 by Sex 88.1% 81.3% 74.6% Source: Toossi, Mitra. “Employment Outlook: 2010-2020: Labor Force Projections to 2020: A More Slowly Growing Workforce,” Monthly Labor Review, January 2012. Prepared by the Community Service Council, with support from the Metropolitan Human Services Commission (5/20/2013).
Civilian Labor Force Participation Rates among Persons 65 to 74 by Sex 35.1% 31.0% 27.5% Source: Toossi, Mitra. “Employment Outlook: 2010-2020: Labor Force Projections to 2020: A More Slowly Growing Workforce,” Monthly Labor Review, January 2012. Prepared by the Community Service Council, with support from the Metropolitan Human Services Commission (5/20/2013).
Trends in Average Incomes of Households by Quintile: 1977-79 to 2008-10: Oklahoma and United States (in 2009 dollars) Oklahoma United States Source: Center on Budget and Policy Priorities and Economic Policy Institute, “Pulling Apart: A State-by-State Analysis of Income Trends,” November 15, 2012.
Community Profile: Tulsa County Prepared by the Community Service Council, with support from the Metropolitan Human Services Commission …is available on our website: www.csctulsa.org