Download
1 / 7
70 likes | 83 Views
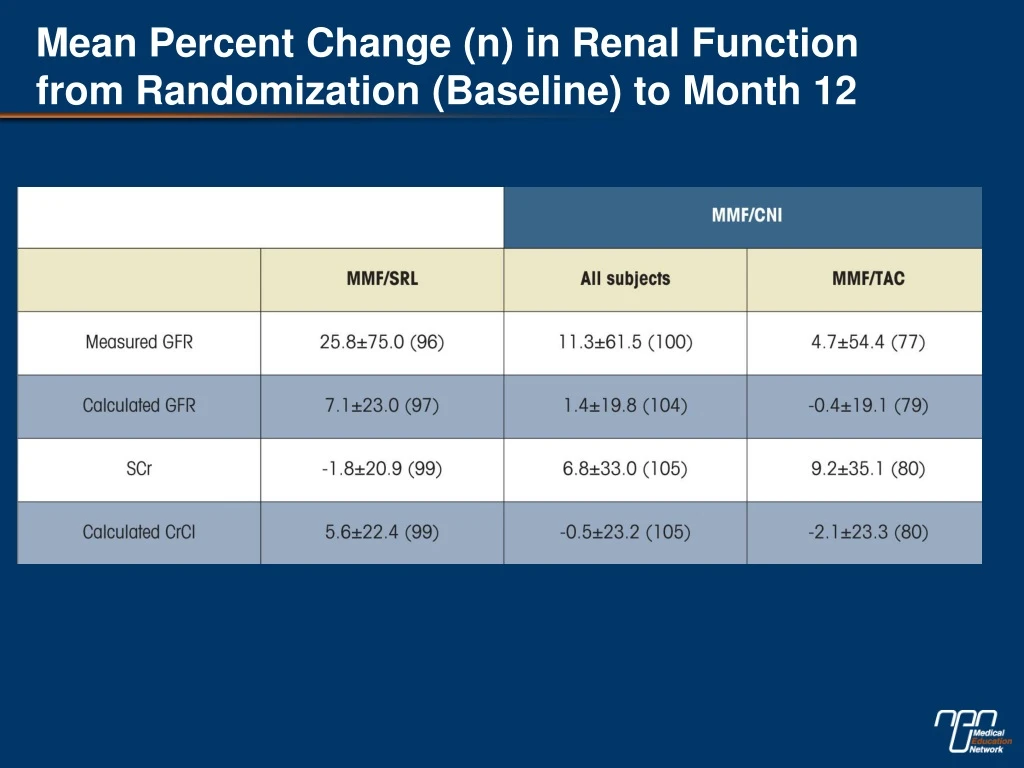
Analyzing renal function change at month 12 in a study with no race, sex, or Ag MM differences. Utilizing thymoglobulin induction and specific drug regimens. Serum creatinine levels monitored. Adapted from Conti et al. ATC 2008 abstract 1525.

E N D
Mean Percent Change (n) in Renal Function from Randomization (Baseline) to Month 12
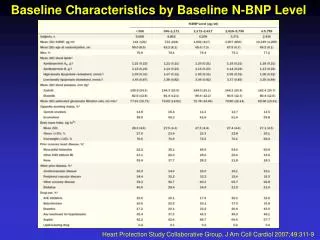
Study Demographics No difference in race, sex and Ag MM between groups
*Events are mutually exclusive because only 1st event counted/patient
Immunotherapy Regimen Selective thymoglobulin induction for delayed graft function Sirolimus load – 10 mg days 1 and 2 maintenance 5 mg/day target 24-hour trough 8 to 12 ng/mL Tacrolimus days 1 to 90, target trough 8 to 12 ng/mL at 3 months 50% dose reduction target trough 2 to 4 ng/mL Prednisone target dose 5 to 7.5 mg/day at 1 year Adapted from Conti et al. ATC 2008, abstract 1525.
Mean Serum Creatinine Levels Adapted from Conti et al. ATC 2008, abstract 1525.