Download
1 / 45
450 likes | 590 Views
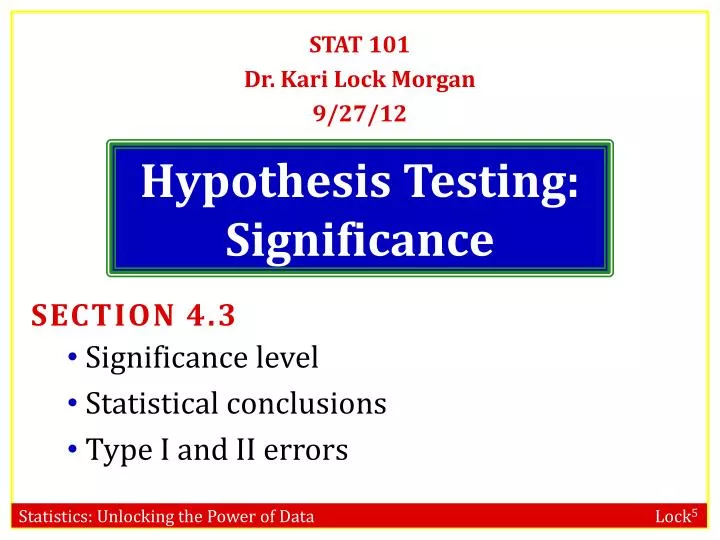
STAT 101 Dr. Kari Lock Morgan 9/27/12. Hypothesis Testing: Significance. SECTION 4.3 Significance level Statistical conclusions Type I and II errors. Office Hours. My office hours next week will be Wednesday 1 – 3pm, NOT Monday (and Thurs 1 – 2:30 as always).

E N D
STAT 101 Dr. Kari Lock Morgan 9/27/12 Hypothesis Testing: Significance • SECTION 4.3 • Significance level • Statistical conclusions • Type I and II errors
Office Hours • My office hours next week will be Wednesday 1 – 3pm, NOT Monday • (and Thurs 1 – 2:30 as always)
Randomization Distributions • p-values can be calculated by randomization distributions: • simulate samples, assuming H0 is true • calculate the statistic of interest for each sample • find the p-value as the proportion of simulated statistics as extreme as the observed statistic • Let’s do a randomization distribution for a randomized experiment…
Cocaine Addiction • In a randomized experiment on treating cocaine addiction, 48 people were randomly assigned to take either Desipramine (a new drug), or Lithium (an existing drug), and then followed to see who relapsed • Question of interest: Is Desipramine better than Lithium at treating cocaine addiction?
Cocaine Addiction • What are the null and alternative hypotheses? • What are the possible conclusions? pD, pL: proportion of cocaine addicts who relapse after taking Desipramine or Lithium, respectively H0: pD = pL Ha: pD < pL Reject H0; Desipramine is better than Lithium Do not reject H0: We cannot determine from these data whether Desipramine is better than Lithium
R R R R R R R R R R R R R R R R R R R R R R R R R R R R R R R R R R R R R R R R R R R R R R R R 1. Randomly assign units to treatment groups Desipramine Lithium R R R R R R R R R R R R R R R R R R R R R R R R R R R R R R R R R R R R R R R R R R R R
2. Conduct experiment 3. Observe relapse counts in each group R = Relapse N = No Relapse 1. Randomly assign units to treatment groups Desipramine Lithium R R R R R R R R R R R R R R R R R R R R R R R R R R R R R R R R R N R N R R R R R R R R R R R R R N R N N N N N N N N N R R R R R R R R R R R R N N N N N N N N N N N N N N N N N N N N N N N N 10 relapse, 14 no relapse 18 relapse, 6 no relapse
Measuring Evidence against H0 To see if a statistic provides evidence against H0, we need to see what kind of sample statistics we would observe, just by random chance, if H0 were true
Cocaine Addiction • “by random chance” means by the random assignment to the two treatment groups • “if H0 were true” means if the two drugs were equally effective at preventing relapses (equivalently: whether a person relapses or not does not depend on which drug is taken) • Simulate what would happen just by random chance, if H0 were true…
R R R R R R R R R R R R R R R R N N R R R R R R N N N N N N R R R R R R N N N N N N N N N N N N 10 relapse, 14 no relapse 18 relapse, 6 no relapse
R R R R R R R R R R R R R R R R N N R R R R R R N N N N N N R R R R R R N N N N N N N N N N N N Simulate another randomization Desipramine Lithium R N R N N N N R R R R R R R N R R N N N R N R R R N N R N R R N R N N N R R R N R R R R 16 relapse, 8 no relapse 12 relapse, 12 no relapse
Simulate another randomization Desipramine Lithium R R R R R R R R R R R R R N R R N N R R R R R R R R N R N R R R R R R R R N R N R R N N N N N N 17 relapse, 7 no relapse 11 relapse, 13 no relapse
Simulate Your Own Sample • In the experiment, 28 people relapsed and 20 people did not relapse. Create cards or slips of paper with 28 “R” values and 20 “N” values. • Pool these response values together, and randomly divide them into two groups (representing Desipramine and Lithium) • Calculate your difference in proportions • Plot your statistic on the class dotplot • To create an entire randomization distribution, we simulate this process many more times with technology: StatKey
www.lock5stat.com/statkey p-value
Formal Decisions • If the p-value is small: • REJECT H0 • the sample would be extreme if H0 were true • the results are statistically significant • we have evidence for Ha • If the p-value is not small: • DO NOT REJECT H0 • the sample would not be too extreme if H0 were true • the results are not statistically significant • the test is inconclusive; either H0 or Ha may be true
Formal Decisions • A formal hypothesis test has only two possible conclusions: • The p-value is small: reject the null hypothesis in favor of the alternative • The p-value is not small: do not reject the null hypothesis How small?
Significance Level p-value < Reject H0 p-value > Do not Reject H0 • The significance level, , is the threshold below which the p-value is deemed small enough to reject the null hypothesis
Significance Level • If the p-value is less than , the results are statistically significant, and we reject the null hypothesis in favor of the alternative • If the p-value is not less than , the results are not statistically significant, and our test is inconclusive • Often = 0.05 by default, unless otherwise specified
Red Wine and Weight Loss • Resveratrol, an ingredient in red wine and grapes, has been shown to promote weight loss in rodents, and has recently been investigated in primates (specifically, the Grey Mouse Lemur). • A sample of lemurs had various measurements taken before and after receiving resveratrol supplementation for 4 weeks BioMed Central (2010, June 22). “Lemurs lose weight with ‘life-extending’ supplement resveratrol. Science Daily.
Red Wine and Weight Loss In the test to see if the mean resting metabolic rate is higher after treatment, the p-value is 0.013. Using = 0.05, is this difference statistically significant? (should we reject H0: no difference?) • Yes • No The p-value is lower than = 0.05, so the results are statistically significant and we reject H0.
Red Wine and Weight Loss In the test to see if the mean body mass is lower after treatment, the p-value is 0.007. Using = 0.05, is this difference statistically significant? (should we reject H0: no difference?) • Yes • No The p-value is lower than = 0.05, so the results are statistically significant and we reject H0.
Red Wine and Weight Loss In the test to see if locomotor activity changes after treatment, the p-value is 0.980. Using = 0.05, is this difference statistically significant? (should we reject H0: no difference?) • Yes • No The p-value is not lower than = 0.05, so the results are not statistically significant and we do not reject H0.
Red Wine and Weight Loss In the test to see if mean food intake changes after treatment, the p-value is 0.035. Using = 0.05, is this difference statistically significant? (should we reject H0: no difference?) • Yes • No The p-value is lower than = 0.05, so the results are statistically significant and we reject H0.
Elephant Example • H0 : X is an elephant • Ha : X is not an elephant • Would you conclude, if you get the following data? • Xwalks on two legs • X has four legs Although we can never be certain! Reject H0; evidence that X is not an elephant Do not reject H0; we do not have sufficient evidence to determine whether X is an elephant
Never Accept H0 • “Do not reject H0” is not the same as “accept H0”! • Lack of evidence against H0 is NOT the same as evidence for H0! “For the logical fallacy of believing that a hypothesis has been proved to be true, merely because it is not contradicted by the available facts, has no more right to insinuate itself in statistical than in other kinds of scientific reasoning…” -Sir R. A. Fisher
Statistical Conclusions In a hypothesis test of H0: = 10 vs Ha: <10 the p-value is 0.002. With α = 0.05, we conclude: • Reject H0 • Do not reject H0 • Reject Ha • Do not reject Ha The p-value of 0.002 is less than α = 0.05, so we reject H0
Statistical Conclusions In a hypothesis test of H0: = 10 vs Ha: < 10 the p-value is 0.002. With α = 0.01, we conclude: • There is evidence that = 10 • There is evidence that < 10 • We have insufficient evidence to conclude anything
Statistical Conclusions In a hypothesis test of H0: = 10 vs Ha: <10 the p-value is 0.21. With α = 0.01, we conclude: • Reject H0 • Do not reject H0 • Reject Ha • Do not reject Ha The p-value of 0.21 is not less than α = 0.01, so we do not reject H0
Statistical Conclusions In a hypothesis test of H0: = 10 vs Ha: < 10 the p-value is 0.21. With α = 0.01, we conclude: • There is evidence that = 10 • There is evidence that < 10 • We have insufficient evidence to conclude anything
Statistical Conclusions Formal decision of hypothesis test, based on = 0.05 : Informal strength of evidence against H0:
Multiple Sclerosis and Sunlight • It is believed that sunlight offers some protection against multiple sclerosis, but the reason is unknown • Researchers randomly assigned mice to one of: • Control (nothing) • Vitamin D Supplements • UV Light • All mice were injected with proteins known to induce a mouse form of MS, and they observed which mice got MS Seppa, Nathan. “Sunlight may cut MS risk by itself”, Science News, April 24, 2010 pg 9, reporting on a study appearing March 22, 2010 in the Proceedings of the National Academy of Science.
Multiple Sclerosis and Sunlight • For each situation below, write down • Null and alternative hypotheses • Informal description of the strength of evidence against H0 • Formal decision about H0, using α = 0.05 • Conclusion in the context of the question • In testing whether UV light provides protection against MS (UV light vs control group), the p-value is 0.002. • In testing whether Vitamin D provides protection against MS (Vitamin D vs control group), the p-value is 0.47.
Multiple Sclerosis and Sunlight • In testing whether UV light provides protection against MS (UV light vs control group), the p-value is 0.002. • H0: pUV – pC= 0 • Ha: pUV – pC< 0 • We have strong evidence against H0 • Reject H0 • We have strong evidence that UV light provides protection against MS, at least in mice.
Multiple Sclerosis and Sunlight • In testing whether Vitamin D provides protection against MS (Vitamin D vs control group), the p-value is 0.47. • H0: pD– pC= 0 • Ha: pD– pC< 0 • We have little evidence against H0 • Do not reject H0 • We cannot conclude anything about Vitamin D and MS.
Errors • There are four possibilities: Decision TYPE I ERROR Truth TYPE II ERROR • A Type I Error is rejecting a true null • A Type II Error is not rejecting a false null
Red Wine and Weight Loss • In the test to see if resveratrol is associated with food intake, the p-value is 0.035. • If resveratrolis not associated with food intake, a Type I Error would have been made • In the test to see if resveratrol is associated with locomotor activity, the p-value is 0.980. • If resveratrol is associated with locomotor activity, a Type II Errorwould have been made
Analogy to Law Ho Ha A person is innocent until proven guilty. Evidence must be beyond the shadow of a doubt. p-value from data Types of mistakes in a verdict? Convict an innocent Type I error Release a guilty Type II error
Probability of Type I Error • The probability of making a Type I error (rejecting a true null) is the significance level, α • α should be chosen depending how bad it is to make a Type I error
Probability of Type I Error Distribution of statistics, assuming H0 true: • If the null hypothesis is true: • 5% of statistics will be in the most extreme 5% • 5% of statistics will give p-values less than 0.05 • 5% of statistics will lead to rejecting H0 at α= 0.05 • If α = 0.05, there is a 5% chance of a Type I error
Probability of Type I Error Distribution of statistics, assuming H0 true: • If the null hypothesis is true: • 1% of statistics will be in the most extreme 1% • 1% of statistics will give p-values less than 0.01 • 1% of statistics will lead to rejecting H0 at α= 0.01 • If α = 0.01, there is a 1% chance of a Type I error
Probability of Type II Error • The probability of making a Type II Error (not rejecting a false null) depends on • Effect size (how far the truth is from the null) • Sample size • Variability • Significance level
Choosing α • By default, usually α = 0.05 • If a Type I error (rejecting a true null) is much worse than a Type II error, we may choose a smaller α, like α = 0.01 • If a Type II error (not rejecting a false null) is much worse than a Type I error, we may choose a larger α, like α = 0.10
Significance Level • Come up with a hypothesis testing situation in which you may want to… • Use a smaller significance level, like = 0.01 • Use a larger significance level, like = 0.10
Summary • Results are statistically significant if the p-value is less than the significance level, α • In making formal decisions, reject H0 if the p-value is less than α, otherwise do not reject H0 • Not rejecting H0 is NOT the same as accepting H0 • There are two types of errors: rejecting a true null (Type I) and not rejecting a false null (Type II)
To Do • Project 1 proposal due TODAY at 5pm • Read Section 4.3 • Do Homework 4 (due Thursday, 10/4)