Download
1 / 9
90 likes | 211 Views
Delve into the future of interdisciplinary research, explore semantic web models, and understand the exponential growth challenges of navigating the vast web graph. Discover how crucial semantics are in transforming e-science and grasp the complexities of data processing in the age of tera-flops and peta-bytes. Join the conversation on the profound impact of explicit and implicit semantics in enhancing interoperability across domains and examine analytic models of deep semantics and markup complexity. Unravel the mysteries of exa-links and their role in shaping the future of scientific communication.

E N D
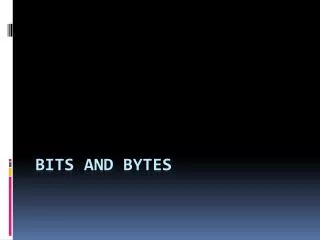
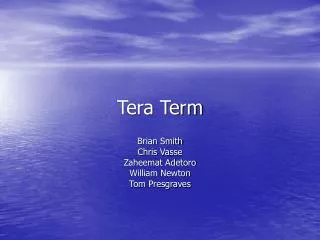
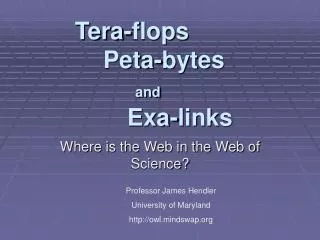
Tera-flops Peta-bytesand Exa-links Where is the Web in the Web of Science? Professor James Hendler University of Maryland http://owl.mindswap.org
MIND SWAP • Maryland Information and Network Dynamics Laboratory, Semantic Web and Agents Project • J. Hendler • B. Parsia • Jennifer Golbeck • Aditya Kalyanpur • Grecia Lapizco-Encinas • Katy Newton • Evren Sirin • Corporate Research Partners: • Fujitsu Laboratory of America, College Park • Lockheed Martin Advanced Technology Laboratories • NTT Corp • SAIC Corp. • Govt Funding: • US Army Research Laboratory, NSF, DARPA, IC • http://owl.mindswap.org (OWL-powered Semantic Web page) • Ronald Alford • Ross Baker • Amy Alford • Matt Westhoff • Kendall Clark • Nada Hashmi
Outline • Justify the title • Exa-links? • Conjecture • Future of Science lies in interdisciplinary work • How scientists communicate • Models and Web of Semantics • Hypothesis • A little bit of semantics goes a long way • C.f. Web service composition (and its challenges) • Outrageous claim • E-science fails without semantics • What’s next?
Solved! Google™ on the WWW ExaLinks • Paths through graphs grow exponentially • Computer scientists have been cursing this for years • Even if P=NP • Imagine a graph of >4e10 nodes • All possible paths an unbelievably large number • O(2^4e10) • Paths of length 4 • Avg links 1/10e7 x links = • 1.2e22 Web Graph?
The new challenge • As we increase the number of processors, the types of data, and the kinds of services • The graph of possibilities grows exponentially • The paths through this graph grows exponentially
(US) Grid computing emphases • Tera-flops • Despite Moore we are compute bound • These problems are HARD • Peta-bytes • We can collect more than we can process • These problems are BIG Japanese Supercomputer Something w/much data NSF Cyberinfrastructure report focuses on moving lots of data toever larger computers
Semantic “Depth” and Complexity “C” represents explicit common formats and assumptions required for effective interoperability between different domains Explicit Semantics - used for interoperability across domains “A” “Deepest” semantics required when no shared domain “C” “B” Implicit Semantics - within a given domain Each circle represents semantics of a service/source and the overlap is the common semantics/terms. “Overlap factor” is C A+B+C Examples - hard-coded routine has high implicit semantics; highly negotiated, annotated composible service has high explicit semantics, etc
Analytic Models of Information Fluidity 100 Ontologies 100 Systems/Ontology “Fluidity” is the largest number of fully interoperable systems over the total number of systems. Ontology mappings occur with probability proportional to the number of systems using an ontology. Based on recent random graph theory (Chung and Lu). Quantifiable, measurable in real systems. 10-100 Ontologies 100 Systems/Ontology Jiang, Cybenko, Hendler.
Analytic Models of Deep Semantics and Markup Complexity t=0.5, levels=1 Within subdomains, there is much overlap “C” Across subdomains, the need for deep semantics to achieve interoperability is much lower t=0.5, levels=2 Markup complexity is measured by the amount of unique markup required. Wmax and zmax are parameters capturing intra and inter domain semantics. Plots of reduction in complexity vs zmax and wmax