Mastering Trigonometric Functions: Theory and Practice for Students
290 likes | 313 Views
Understand periodic functions, amplitudes, and phases. Explore graphing, transformations, and real-world applications.

Mastering Trigonometric Functions: Theory and Practice for Students
E N D
Presentation Transcript
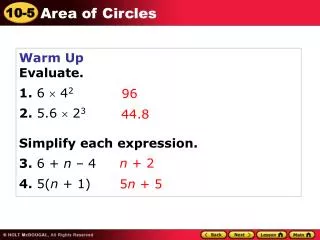
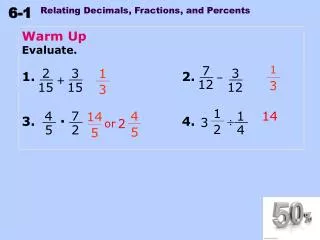
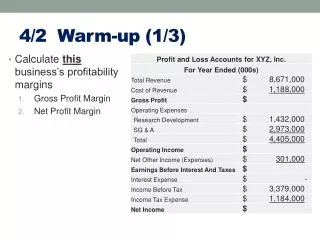
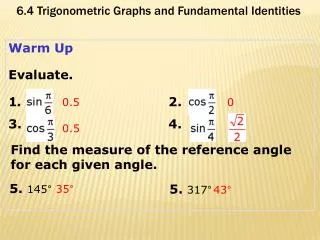
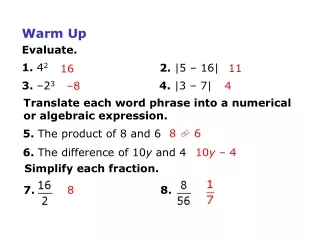
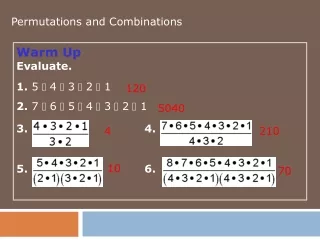
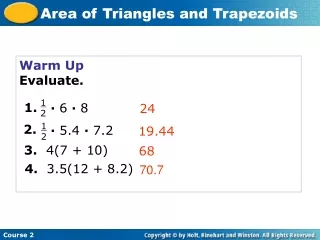
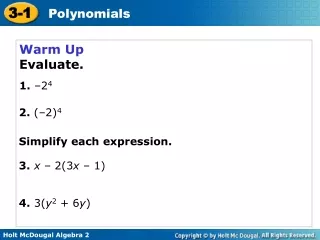
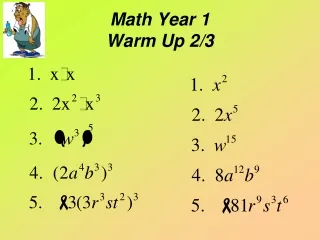
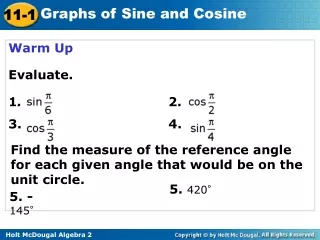
Warm Up Evaluate. 1.2. 3. 4. Find the measure of the reference angle for each given angle that would be on the unit circle. 5. 420° 5. -145°
mode • When to switch the mode: • Anytime you evaluate sine, cosine, or tangent • Anytime you graph sine, cosine or tangent • Switch mode to radians when using radians • Switch mode to degrees when using degrees. • Why switch mode?
Periodic functions are functions that repeat exactly in regular intervals called cycles. The length of the cycle is called its period.
Example 1A: Identifying Periodic Functions Identify whether each function is periodic. If the function is periodic, give the period.
Example 1B: Identifying Periodic Functions Identify whether each function is periodic. If the function is periodic, give the period.
Check It Out! Example 1 Identify whether each function is periodic. If the function is periodic, give the period. a. b.
The trigonometric functions are periodic. You can graph the function f(x) = sin x on the coordinate plane by using y-values from points on the unit circle where the independent variable x represents the angle θin standard position.
The amplitude of sine and cosine functions is half of the difference between the maximum and minimum values of the function. The amplitude is always positive.
Using f(x) = sin x as a guide, graph the function g(x) = Identify the amplitude and period. Example 2: Stretching or Compressing Functions Sine and Cosine Functions Step 1 Identify the amplitude and period.
Example 2 Continued Step 2 Graph.
Using f(x) = cos x as a guide, graph the function h(x) = Identify the amplitude and period. Check It Out! Example 2 Step 1 Identify the amplitude and period.
Check It Out! Example 2 Continued Step 2 Graph.
Graphing using the graphing calculator… **consider mode ** consider scale **consider window
Graphing using the graphing calculator… **consider mode **consider scale **consider window
Sine and cosine functions can be used to model real-world phenomena, such as sound waves. Different sounds create different waves. One way to distinguish sounds is to measure frequency. Frequency is the number of cycles in a given unit of time, so it is the reciprocal of the period of a function. Hertz (Hz) is the standard measure of frequency and represents one cycle per second. For example, the sound wave made by a tuning fork for middle A has a frequency of 440 Hz. This means that the wave repeats 440 times in 1 second.
Example 3: Sound Application Use a sine function to graph a sound wave with a period of 0.002 s and an amplitude of 3 cm. Find the frequency in hertz for this sound wave.
Check It Out! Example 3 Use a sine function to graph a sound wave with a period of 0.004 s and an amplitude of 3 cm. Find the frequency in hertz for this sound wave.
Sine and cosine can also be translated as y = sin(x–h) + k y = cos(x–h) + k. Recall that a vertical translation by kunits moves the graph up (k > 0) or down (k < 0). A phase shift is a horizontal translation of a periodic function. A phase shift of hunits moves the graph left (h < 0) or right (h > 0).
Using f(x) = sin x as a guide, graph g(x) = g(x) = sin Identify the phase shift and graph.
Using f(x) = cos x as a guide, graph g(x) = cos(x –). Identify the phase shift and graph. Check It Out! Example 4
Amplitude Phase shift Vertical shift Period You can combine the transformations of trigonometric functions. Use the values of a, b, h, andkto identify the important features of a sine or cosine function. y =asinb(x–h)+k
The number of people, in thousands, employed in a resort town can be modeled by, where x is the month of the year. Example 5: Employment Application A. Graph the number of people employed in the town for one complete period.
What if…? Suppose that the height H of a Ferris wheel can be modeled by, , where t is the time in seconds. Check It Out! Example 5 a. Graph the height of a cabin for two complete periods.