Psychological Errors and Logical Pitfalls in Racial Profiling
170 likes | 363 Views
Psychological Errors and Logical Pitfalls in Racial Profiling. Jack Glaser Goldman School of Public Policy UC Berkeley. OVERVIEW. The Psychology: Problems with the accuracy of stereotypes The Logic: Problems with the applicability of stereotypes

Psychological Errors and Logical Pitfalls in Racial Profiling
E N D
Presentation Transcript
Psychological Errors and Logical Pitfalls in Racial Profiling Jack Glaser Goldman School of Public Policy UC Berkeley
OVERVIEW • The Psychology: Problems with the accuracy of stereotypes • The Logic: Problems with the applicability of stereotypes • The Math: Problems with the efficacy of racial profiling
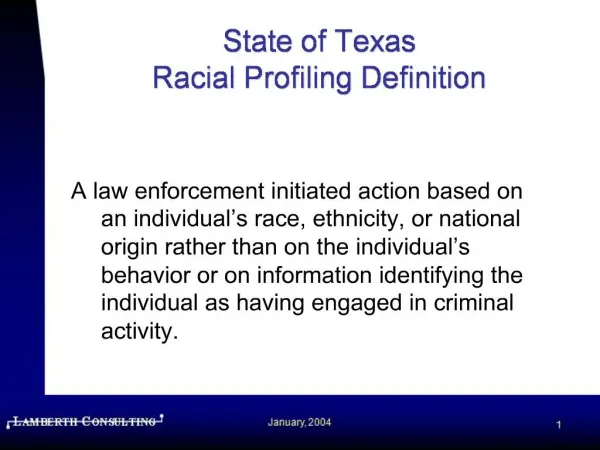
What is Racial Profiling? • The use of race, ethnicity, or national origin (or proxies thereof), by law enforcement to determine criminal suspicion • Most prevalent in drug interdiction • Distinct from criminal/offender profiling
Psychological Perspective: Profiling as Stereotype-based Discrimination • Stereotype: a belief about the traits typically possessed by members of a group • Stereotypes serve an adaptive function: heuristic – cognitive shortcut to simplify a complex world • Are stereotypes overgeneralizations? Are they accurate? Does it matter?
Factors Influencing Accuracy • Indirect Experience • Direct Experience • Illusory correlation • Tendency to stereotype is compounded by outgroup homogeneity effect • Stereotypes are resistant to change • Predictions about individuals are problematic
Logic: Affirming the Consequent • Even if a stereotype is “accurate” (i.e., based on a real correlation), we run the risk of affirming the consequent • If A, then B • A, therefore B • B, therefore A X • If criminal, then likely to be minority • Criminal, therefore likely to be minority • Minority, therefore likely to be criminal X
The Math: Effect of Profiling • Difficulties with studying profiling: • Reports of profiling (e.g., Gallup poll) based on subjective experience • Police stop/arrest data lack “benchmarks” • GAO (and CA LAO) frustration • Particularly difficult to determine the effect/iveness of racial profiling • Do not know true “criminality rate”
Modeling Racial Profiling • Assume criminality of groups is stable across time (through attrition and renewal) • Assume criminals who are stopped are convicted/incarcerated in equal proportions across groups • Generate hypothetical data (multiple scenarios), test effect of profiling over time • Attempting to simulate only the contribution that profiling makes
Modeling Racial Profiling It = It-1 + σ(C – It-1) – ρIt-2
Group % of Population Incarcerated at Start (It=0) Criminality Rate (C) Stop Rate (σ) No-Profiling Scenario: No Diffs. A 20% 5% 10% 5% B 80% 5% 10% 5% Total 100% 5% 10% 5%
Group % of Population Incarcerated at Start Criminality Rate Stop Rate No-Profiling Scenario: Differences A 20% 12.5% 25% 5% B 80% 3.125% 6.25% 5% Total 100% 5% 10% 5%
Group % of Population Incarcerated at Start Criminality Rate Stop Rate Profiling: No True Difference A 20% 5% 10% 20% B 80% 5% 10% 1.25% Total 100% 5% 10% 5%
Group % of Population Incarcerated at Start Criminality Rate Stop Rate Profiling: Real Difference A 20% 12.5% 25% 20% B 80% 3.125% 6.25% 1.25% Total 100% 5% 10% 5%
Group % of Population Incarcerated at Start Criminality Rate Stop Rate Extreme Profiling: Real Difference A 20% 12.5% 25% 25% B 80% 3.125% 6.25% 0% Total 100% 5% 10% 5%
Group % of Population Incarcerated at Start Criminality Rate Stop Rate Extreme Profiling: No Diffs. A 20% 5% 10% 25% B 80% 5% 10% 0% Total 100% 5% 10% 5%
Conclusions • Profiling is assumed to increase police efficiency, lead to more convictions, and is thus justified (re public safety), but… • The efficiency of profiling may be illusory • Stereotypes may be misleading • “Benefits” may attenuate rapidly • Self-fulfilling effect on targets • Neglects large criminal population
Relevance to Counter-Terrorism • Differences with drug courier profiling: • May be an instrumental connection between group membership and behavior • Correlation may be stronger • Much rarer events • We are farther along on the drug-war “curve” • Similarities: affirming the consequent still applies • Searching in a large haystack • Neglect non-Middle Eastern/Muslim terrorists