Data Envelopment Analysis with Unbalanced Data
Data Envelopment Analysis with Unbalanced Data. Timo Kuosmanen (Wageningen University, The Netherlands) INFORMS Annual Meeting, Atlanta 19-22 October 2003. Unbalanced data ?. Suppose output j of DMU k is missing (unavailable). Unbalanced data ?.


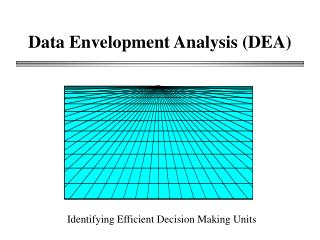
Data Envelopment Analysis with Unbalanced Data
E N D
Presentation Transcript
Data Envelopment Analysis with Unbalanced Data Timo Kuosmanen (Wageningen University, The Netherlands) INFORMS Annual Meeting, Atlanta 19-22 October 2003
Unbalanced data? • Suppose output j of DMU kis missing (unavailable).
Unbalanced data? • Suppose output j of DMU kis missing (unavailable). • Usual approach is to restore a balanced output matrix by • excluding DMU k
Unbalanced data? • Suppose output j of DMU kis missing (unavailable). • Usual approach is to restore a balanced output matrix by • excluding DMU k
Unbalanced data? • Suppose output j of DMU kis missing (unavailable). • Usual approach is to restore a balanced output matrix by • excluding DMU k • excluding output j
Problems • Both approaches involve a lossof information about production possibilities in • observed outputs of discarded DMU k • observed values of excluded output j • The choice to exclude either DMU or output influences the results • Criteria for excluding rows/columns are typically not explicitly reported
Proposition • Why don’t we simply tolerate the missing piece of data and denote the missing output value by zero (0)? • Zero is the theoretical lower bound for output values. • No technical reason for including 0 outputs in DEA.
Notation Define the following production possibility sets: TDMU : exclude the DMU with missing value TY : exclude the output with missing value TUB: denote missing output by 0 TIDEAL : ideal case where all data are available
Main Theorem Production possibility sets TUB, TIDEAL, TDMU, and TY are nested in the sense that
Influence on efficiency scores Theorem 2: For DMU k with missing value of output j, using unbalanced data and eliminating output j yield equal DEA efficiency scores. Theorem 3: For DMU l with complete data, using unbalanced data can only yield worse efficiency score than excluding DMU k with missing data from the reference set.
Equity issues • The unbalanced DEA model imposes DMUs with missing outputs more stringent efficiency criteria • might be viewed unfair • incentives for collecting & reporting data • Even if we exclude DMUs with missing outputs from efficiency comparisons / rankings, there is no harm in including them in the reference technology! • Might adjust the efficiency scores to take into account differences in dimensionality across DMUs?
Extensions • Missing inputs can be handled analogously by labeling blank entries by some big M. • Weight restrictions can interfere with the results in unintended way. We may relax weight restrictions by writing them as ----------->
Case study: Sustainable Development indices • Cherchye & Kuosmanen (2002) use DEA to construct a meta-index of Sustainable Development (SD) from 14 (SD) indicators for 154 countries. • The 14x143 data matrix contains 2156 elements, of which 18% (= 395 elements) were missing. • Complete data available only for 14 countries.
Conclusions • A first systematic attempt to analyze the effects of eliminating missing values • Keeping blank entries in the output data can only improve estimation of the production frontier. • Differences in dimensionality across DMUs can be unfair for DMUs with good performance in missing outputs • Research question: Can a fair handicap system be constructed for making efficiency scores better comparable if dimensionality differs across DMUs???
Want to read more? • Full paper can be downloaded from my homepage: http://www.sls.wau.nl/enr/staff/kuosmanen/ • Or send e-mail to: Timo.Kuosmanen@wur.nl