Download
1 / 28
280 likes | 356 Views
Explore educational attainment data of 25 to 64-year-olds, including degrees earned and high school completion rates in Southern Oklahoma. Analyze population changes and demographics from U.S. Census Bureau reports.

E N D
Oklahoma Regional Demographic Profiles Southern Region Created from the U.S. Census Bureau’s American Community Survey (2005-07 Public Use Microdata Sample) June 2009 Created by the National Center for Higher Education Management Systems
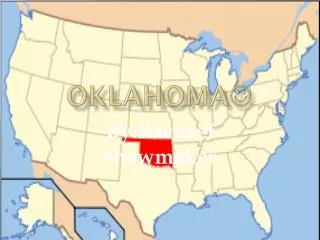
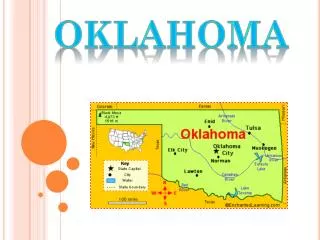
Oklahoma Regions for “Making Place Matter” Data 13 1 5 12 11 1. Northwest/Panhandle 2. Southwest 3. South Central/Lawton 4. El Reno/Chickasha 5. Enid/Ponca City 6. Oklahoma City Metro 7. Guthrie/Shawnee 8. Norman/Moore 9. Southern 10.Osage/Stillwater/Seminole 11. Tulsa County 12. Rogers/Wagoner 13. Northeast 14. Eastern 15. Southeast 10 7 14 6 2 8 4 3 15 9 U.S. Census Bureau’s Public Use Microdata Samples
Oklahoma Title IV Degree-Granting Institution Locations Public 4-Year Public 2-Year Private 4-Year Private 2-Year
Oklahoma Public Title IV Degree-Granting Institution Locations Public 4-Year Public 2-Year
Oklahoma Public Title IV Degree-Granting Institution Locations Southern Region Public 4-Year Public 2-Year East Central University Murray State College Southeastern Oklahoma State University
East Central University – Counties that Account for 80% of In-State First-Time Students (Fall 2008) Woods Ottawa Harper Grant Kay Nowata Craig Cimarron Texas Beaver Alfalfa Washington Osage Woodward Delaware Rogers Garfield Noble Pawnee Mayes Major Ellis Tulsa Payne Dewey Adair Wagoner Kingfisher Logan Creek Cherokee Blaine Lincoln Okmulgee Muskogee Roger Mills Custer Oklahoma Canadian Okfuskee Sequoyah Mcintosh Washita Cleveland Beckham Seminole Caddo Haskell Pottawatomie Grady Hughes Pittsburg Mcclain Greer Latimer Le Flore Kiowa Harmon Pontotoc Garvin Comanche Coal Jackson Stephens Murray Pushmataha Tillman Atoka Johnston Cotton Carter Jefferson Mccurtain Choctaw Marshall Love Bryan Source: Oklahoma State Regents for Higher Education
Southeastern Oklahoma State University – Counties that Account for 80% of In-State First-Time Students (Fall 2008) Woods Ottawa Harper Grant Kay Nowata Craig Cimarron Texas Beaver Alfalfa Washington Osage Woodward Delaware Rogers Garfield Noble Pawnee Mayes Major Ellis Tulsa Payne Dewey Adair Wagoner Kingfisher Logan Creek Cherokee Blaine Lincoln Okmulgee Muskogee Roger Mills Custer Oklahoma Canadian Okfuskee Sequoyah Mcintosh Washita Cleveland Beckham Seminole Caddo Haskell Pottawatomie Grady Hughes Pittsburg Mcclain Greer Latimer Le Flore Kiowa Harmon Pontotoc Garvin Comanche Coal Jackson Stephens Murray Pushmataha Tillman Atoka Johnston Cotton Carter Jefferson Mccurtain Choctaw Marshall Love Bryan Source: Oklahoma State Regents for Higher Education
Total Population Change (%) by Region, 2000-07 Southeast South Central/Lawton Southwest Northwest/Panhandle Source: U.S. Census Bureau, 2007 American Community Survey.
Age 18 to 24 Population Change (%) by Region, 2000-07 Southern Southwest Northwest/Panhandle Oklahoma City Metro Tulsa County South Central/Lawton Southeast Enid/Ponca City Source: Canadian, Grady, and McClain County estimates, U.S. Census Bureau Population Estimates
Age 25 to 49 Population Change (%) by Region, 2000-07 Oklahoma Northwest/Panhandle El Reno/Chickasha Northeast Osage/Stillwater/Seminole Tulsa County Southwest South Central/Lawton Source: U.S. Census Bureau, 2007 American Community Survey.
Educational Attainment of 25 to 64 Year Olds, 2005-07 Source: U.S. Census Bureau, 2005-07 American Community Survey (ACS) Three-Year Public Use Microdata Sample (PUMS) File.
Educational Attainment of 18 to 24 Year Olds, 2005-07 Source: U.S. Census Bureau, 2005-07 American Community Survey (ACS) Three-Year Public Use Microdata Sample (PUMS) File.
Educational Attainment (%) of 25 to 64 Year Olds by Race/Ethnicity, 2005-07 (Southern Region) Source: U.S. Census Bureau, 2005-07 American Community Survey (ACS) Three-Year Public Use Microdata Sample (PUMS) File.
Percent of 25 to 64 Year Olds with at Least a High School Diploma, 2005-07 Source: U.S. Census Bureau, 2005-07 American Community Survey (ACS) Three-Year Public Use Microdata Sample (PUMS) File.
Percent of 25 to 64 Year Olds with a High School Diploma, but No College, 2005-07 Source: U.S. Census Bureau, 2005-07 American Community Survey (ACS) Three-Year Public Use Microdata Sample (PUMS) File.
Percent of 25 to 64 Year Olds with an Associates Degree or Higher, 2005-07 Source: U.S. Census Bureau, 2005-07 American Community Survey (ACS) Three-Year Public Use Microdata Sample (PUMS) File.
Percent of 25 to 64 Year Olds with a Bachelor’s Degree or Higher, 2005-07 Source: U.S. Census Bureau, 2005-07 American Community Survey (ACS) Three-Year Public Use Microdata Sample (PUMS) File.
Percent of 25 to 64 Year Olds with a Graduate or Professional Degree, 2005-07 Source: U.S. Census Bureau, 2005-07 American Community Survey (ACS) Three-Year Public Use Microdata Sample (PUMS) File.
Percent of 18 to 24 Year Olds with at Least a High School Diploma, 2005-07 Source: U.S. Census Bureau, 2005-07 American Community Survey (ACS) Three-Year Public Use Microdata Sample (PUMS) File.
Percent of 18 to 24 Year Olds with a High School Diploma, But No College, 2005-07 Source: U.S. Census Bureau, 2005-07 American Community Survey (ACS) Three-Year Public Use Microdata Sample (PUMS) File.
Percent of 18 to 64 Year Olds Who Have Just a High School Diploma or Less and are Living in Families with Incomes Below a Living Wage Source: U.S. Census Bureau, 2005-07 American Community Survey (ACS) Three-Year Public Use Microdata Sample (PUMS) File.
Number of 18 to 64 Year Olds Who Have Just a High School Diploma or Less and are Living in Families with Incomes Below a Living Wage Oklahoma = 456,545 Source: U.S. Census Bureau, 2005-07 American Community Survey (ACS) Three-Year Public Use Microdata Sample (PUMS) File.
Percentage Employment by Industry, 2005-07 Source: U.S. Census Bureau, 2005-07 American Community Survey (ACS) Three-Year File.
Percentage Employment by Occupation, 2005-07 Source: U.S. Census Bureau, 2005-07 American Community Survey (ACS) Three-Year File.
Median Earnings by Degree-Level, 2005-07 Source: U.S. Census Bureau, 2005-07 American Community Survey (ACS) Three-Year Public Use Microdata Sample (PUMS) File.
Increase in Earnings from a High School Diploma to a College Degree, 2005-07 Source: U.S. Census Bureau, 2005-07 American Community Survey (ACS) Three-Year Public Use Microdata Sample (PUMS) File.
Average Annual Net Migration by Degree-Level (2005-2007) 22-64 Year Olds (Northwest/Panhandle Region) Less than High School High School Graduate Bachelors Degree or Higher All Education Levels Source: U.S. Census Bureau, 2005-07 American Community Survey (ACS) Three-Year Public Use Microdata Sample (PUMS) File.
Age 16+ Average Annual Migration by Occupation Group, 2005-07(Southern Region) Management & Professional Services Sales & Office All Four Occupation Groups Source: U.S. Census Bureau, 2005-07 American Community Survey (ACS) Three-Year Public Use Microdata Sample (PUMS) File.