
Uploaded by
jenski
1 SLIDES
115 VIEWS
10LIKES
Insights from Yesterday's Tag Activity: Surprising Results Revealed
DESCRIPTION
Yesterday's tag activity yielded intriguing results displayed in the graph. Analyze the data critically to identify any unexpected trends or patterns. What insights can you glean from the visual representation? Are there anomalies or trends that defy your anticipations? Share your thoughts on why these results might be surprising, or explain why they align with your expectations. Join the discussion to deepen our understanding of the data's implications on our activities and strategies moving forward.
Download
1 / 1
Download Presentation 
Insights from Yesterday's Tag Activity: Surprising Results Revealed
An Image/Link below is provided (as is) to download presentation
Download Policy: Content on the Website is provided to you AS IS for your information and personal use and may not be sold / licensed / shared on other websites without getting consent from its author.
Content is provided to you AS IS for your information and personal use only.
Download presentation by click this link.
While downloading, if for some reason you are not able to download a presentation, the publisher may have deleted the file from their server.
During download, if you can't get a presentation, the file might be deleted by the publisher.
E N D
Presentation Transcript
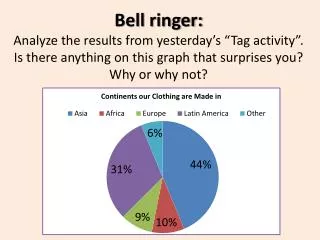
Bell ringer:Analyze the results from yesterday’s “Tag activity”. Is there anything on this graph that surprises you? Why or why not?
More Related