Download
1 / 16
160 likes | 228 Views
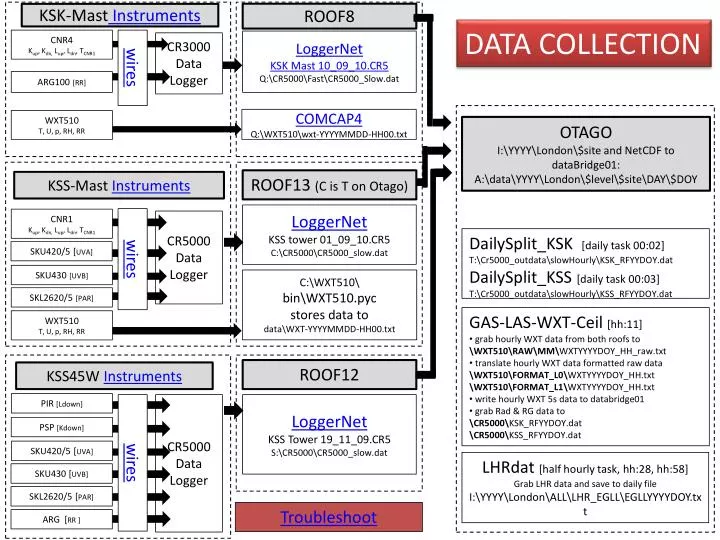
ROOF8. KSK-Mast Instruments. DATA COLLECTION. CNR4 K up , K dn , L up , L dn , T CNR1. LoggerNet KSK Mast 10_09_10.CR5 Q :CR5000FastCR5000_Slow.dat. CR3000 Data Logger. wires. ARG100 [RR]. OTAGO I:YYYYLondon$site and NetCDF to dataBridge01:

E N D
ROOF8 KSK-Mast Instruments DATA COLLECTION CNR4 Kup, Kdn,Lup, Ldn, TCNR1 LoggerNet KSK Mast 10_09_10.CR5 Q:\CR5000\Fast\CR5000_Slow.dat CR3000 Data Logger wires ARG100 [RR] OTAGO I:\YYYY\London\$site and NetCDF to dataBridge01: A:\data\YYYY\London\$level\$site\DAY\$DOY COMCAP4 Q:\WXT510\wxt-YYYYMMDD-HH00.txt WXT510 T, U, p, RH, RR ROOF13 (C is T on Otago) KSS-Mast Instruments ROOF12 KSS45W Instruments LoggerNet KSS tower 01_09_10.CR5 C:\CR5000\CR5000_slow.dat CR5000 Data Logger CNR1 Kup, Kdn,Lup, Ldn, TCNR1 CR5000 Data Logger LoggerNet KSS Tower 19_11_09.CR5 S:\CR5000\CR5000_slow.dat SKU420/5 [UVA] wires DailySplit_KSK[daily task 00:02] T:\Cr5000_outdata\slowHourly\KSK_RFYYDOY.dat DailySplit_KSS[daily task 00:03] T:\Cr5000_outdata\slowHourly\KSS_RFYYDOY.dat SKU430 [UVB] C:\WXT510\ bin\WXT510.pyc stores data to data\WXT-YYYYMMDD-HH00.txt wires SKL2620/5 [PAR] WXT510 T, U, p, RH, RR • GAS-LAS-WXT-Ceil [hh:11] • grab hourly WXT data from both roofs to • \WXT510\RAW\MM\WXTYYYYDOY_HH_raw.txt • translate hourly WXT data formatted raw data • \WXT510\FORMAT_L0\WXTYYYYDOY_HH.txt • \WXT510\FORMAT_L1\WXTYYYYDOY_HH.txt • write hourly WXT 5s data to databridge01 • grab Rad & RG data to • \CR5000\KSK_RFYYDOY.dat • \CR5000\KSS_RFYYDOY.dat PIR [Ldown] PSP [Kdown] SKU420/5 [UVA] LHRdat[half hourly task, hh:28, hh:58] Grab LHR data and save to daily file I:\YYYY\London\ALL\LHR_EGLL\EGLLYYYYDOY.txt SKU430 [UVB] SKL2620/5 [PAR] Troubleshoot ARG [RR ]
Data02 Scripts in /home/micromet/Roofprograms dataBridge01 on /media/micromet/data DATA POCESSING • WXTDataPro_V2.R [01:20] • /home/micromet/Roofprograms/WXT/WXTDataPro_V2.R • L0: convert KSK, KSS and NDT WXT data into netcdf • L1: check data on physically reasonable thresholds and correct wind direction to BNG north • with temporal resolutions 5sec, 1min, 5min, 10 min, 30min • Output saved to respective DAY directory on dataBridge01 • RadRainNcdf.m[02:00~] • /D drive on Otago:/Roof/Rad_Rain/RadRainNcdf.m (mergeARG.sh and mergeRAD.sh on Data02/home/micromet/script/cronJobs/) • L0: converts radiation (CNR4 KSK, CNR1/Skye KSS, SPN1 & Eppleys/Skye KSS45W) and ARG100 data into netcdf • Higher Levels: Please refer to the KUMA Manual http://geography.kcl.ac.uk/micromet/Manuals/Manual_KUMA.pdf • PlotMetObs.sh [03:55] • /home/micromet/Roofprograms/WXT/PlotMertObs.sh • Use Matlab program PlotMetObs.m to generate eps plots for WXT data and radiation, combining all instruments from all sites • Convert to png via gnuplot and save to /media/micromet/works/$YEAR/London/Level_1/MetObs • ftp png plots MetObs.png and RadObs.png to web • WXTgapFill.R[run on demand...] • /home/micromet/Roofprograms/WXT/WXTgapFill.R • L2: gap fill WXT data from KSK and KSS by • Linear interpolation b) readings from alternative site c) predicted value
KSK • WXT510 • 2D-sonic: horizontal wind speed [m/s], wind direction [ °] • RAINCAP (counts hits by raindrops): precipitation [mm] • BAROCAP (capacitive silicon sensor ): barometric pressure [hPa] • THERMOCAP (capacitive ceramic sensor): air temperature [°C] • HUMICAP (capacitive thin film polymer): relative humidity [%] back • ARG100 • Tipping bucket: • precipitation [mm] • CNR4 • CM3up: shortwave incoming radiation [W/m2] • CM3dn: shortwave outgoing radiation [W/m2] • CG3up: longwave incoming radiation [W/m2] • CG3dn: longwave outgoing radiation [W/m2] • PT100: housing temperature [K]
KSK PT100 signal + (yellow) PT100 signal - (green) CNR4 back CM3dn signal +(white) CM3dn signal - (black) CG3up signal + (grey) CG3up signal - (yellow) CG3dn signal + (brown) CG3dn signal - (green) CM3up signal + (red) CM3up signal - (blue) 8H 8L 2H 2L 3H 3L 4H 4L 1H 1L SDI-Signal (blue) SDI-Signal (white) Signal ground (green) ARG100 WXT510 Power (red) Ground (black) Power (brown) Ground (no) Signal (black) Signal ground (black) 2 3 5 Serial-to-USB + IX1 - IXR P1
KSS • WXT510 • 2D-sonic: horizontal wind speed [m/s], wind direction [ °] • RAINCAP (counts hits by raindrops): precipitation [mm] • BAROCAP (capacitive silicon sensor ): barometric pressure [hPa] • THERMOCAP (capacitive ceramic sensor): air temperature [°C] • HUMICAP (capacitive thin film polymer): relative humidity [%] back • UV/PAR • [μmol/m2s1 and W/m2] • SKU420: UVA • SKU430: UVB • SKL2620: PAR • (Photosynthetic • active radiation) • ARG100 • Tipping bucket: • precipitation [mm] • CNR1 • CM3up: shortwave incoming radiation [W/m2] • CM3dn: shortwave outgoing radiation [W/m2] • CG3up: longwave incoming radiation [W/m2] • CG3dn: longwave outgoing radiation [W/m2] • PT100: housing temperature [K]
KSS PT100 signal + (yellow) PT100 signal - (green) CNR1 back CM3dn signal +(white) CM3dn signal - (black) CG3up signal + (purple) CG3up signal - (yellow) CG3dn signal + (brown) CG3dn signal - (green) CM3up signal + (red) CM3up signal - (blue) 8H 8L SDI-Signal (blue) SDI-Signal (white) Signal ground (green) 2H 2L 3H 3L 4H 4L 1H 1L UV/PAR WXT510 UVA signal (yellow) UVA signal ground (green) UVB signal (brown) UVB signal ground (purple) Quantum (blue) Power for UV/PAR (red) Ground for UV/PAR (black) Power (red) Ground (blue) Power (black) Ground (red) 2 3 5 Serial-to-USB 5H 5L 6H 6L 7H 5V G IX1 IXR 12V G
KSS45W back • UV/PAR • [μmol/m2s1 and W/m2] • SKU420: UVA • SKU430: UVB • SKL2620: PAR • (Photosynthetic • active radiation) • ARG100 • Tipping bucket: • precipitation [mm] • CNR1 • CM3up: shortwave incoming radiation [W/m2] • CM3dn: shortwave outgoing radiation [W/m2] • CG3up: longwave incoming radiation [W/m2] • CG3dn: longwave outgoing radiation [W/m2] • PT100: housing temperature [K]
back Conversion of measured Voltage into meteorological parameters by SimpleTowerProgram Short-wave in: VoltDiff(CM3Up,1,mV20,1,True,0,_50Hz,88.1057,0) Short-wave out: VoltDiff(CM3Dn,1,mV20,2,True,0,_50Hz,88.1057,0) Long-wave in: VoltDiff(CG3Up,1,mV20,3,True,0,_50Hz,88.1057,0) Long-wave out: VoltDiff(CG3Dn,1,mV20,4,True,0,_50Hz,88.1057,0) UVA: VoltDiff(UVAv,1,mV5000,5,True,0,_50Hz,1.0,-0.03) UVAW=UVAv* 0.02082 UVAm=UVAv* 0.059666 UVB: VoltDiff(UVBv,1,mV1000,6,True,0,_50Hz,1.0,0.14) UVBW=UVBv* 0.014755 UVBm=UVBv* 0.036523 Quantum: VoltSe(Quantumv,1,mV5000,13,True,0,_50Hz,1.0,0.08) QuantumW=Quantumv* 0.11926 Quantumm=Quantumv* 0.59988 CNR1 Temperature: Resistance(CNR1TK,1,mV200,8,Ix1,1,1675,True,True,200,250,0.01,0) PRT(CNR1TK,1,CNR1TK,1,273.15) CNR1TC=CNR1TK-273.15 Net Radiation: NetR=(CM3Up-CM3Dn)+(CG3Up-CG3Dn) Precipitation PulseCount(RainTips,1,2,2,0,1,0)
CNR1 Mean Data File Convention • Who: Duick Young 23 March 2009 • File convention for data files stored in ...\KCLroof\YYYY\CR5000\ • File name structure RFYYDDD.dat • File convention started: 18th August 2008 (DOY 231) • Generated by: Simple Tower Program _V1.1.CR3 • Column Variable Units • 1 Year • Month • Day • 4 Hour • 5 Minute • 6 Kdn- Average W m-2 • 7 Kdn-- Standard Deviation W m-2 • 8 Kup - Average W m-2 • 9 Kup - Standard Deviation W m-2 • 10 Ldn-- Average W m-2 • 11 Ldn-- Standard Deviation W m-2 • 12 Lup - Average W m-2 • 13 Lup - Standard Deviation W m-2 • 14 CNR1 Temperature - Average °C • 15 CNR1 Temperature – StDev ° C • 16 CNR1 Temperature – Average K • 17 CNR1 Temperature – StDev K • 18 Net Radiation – Average W m-2 • 19 Net Radiation – StDev W m-2 • 20 UVA – Average μmol m-2 s-1 • 21 UVB – Average μmol m-2 s-1 • 22 Quantum (PAR) – Average μmol m-2 s-1 • 23 UVA – Average W m-2 • 24 UVB – Average W m-2 • 25 Quantum (PAR) – Average W m-2 • 26 UVA - Standard Deviation μmol m-2 s-1 • 27 UVB - Standard Deviation μmol m-2 s-1 • 28 Quantum (PAR) – StDevμmol m-2 s-1 • 29 Quantum (PAR) – StDevμmol m-2 s-1 • 30 Tipping Bucket Rain Gauge mm back WXT 510 Mean Data File Convention Who: Duick Young 22/7/07 File convention for data files stored in W:\KCLroof\YYYY\WXT510\MM\ File name structure WXTYYYYDDD_15.txt. File Convention started 16th July 2007 (DOY 2197) Flags added 6th August 2007 (DOY 218) Generated by: MATLAB using WXTmeanplot#.m Column Variable Units 1 Day of Year (DOY) 2 Decimal Time 3 Hour 4 Minute 5 Number of Samples 6 Wind Speed Minimum m s-1 7 Wind Speed Mean m s-1 8 Wind Speed Maximum m s-1 9 Air Temperature °C 10 Relative Humidity % 11 Air Pressure hPa 12 U (Wind Component) m s-1 13 V (Wind Component) m s-1 14 Wind Direction ° 15 Total Rain Accumulation mm 16 Total Rain Duration s 17 Total Hail Accumulation hits cm-2 18 Total Hail Duration s 19 Standard Deviation – Wind Speed Minimum m s-1 20 Standard Deviation – Wind Speed Mean m s-1 21 Standard Deviation – Wind Speed Maximum m s-1 22 Standard Deviation – Air Temperature °C 23 Standard Deviation – Relative Humidity % 24 Standard Deviation – Air Pressure hPa 25 Standard Deviation – U m s-1 26 Standard Deviation – V m s-1 27 Flag Flags 1 Data fine 5 Less than 90 data lines in 15 minute averaging period 6 No data present during 15 minute averaging period
Flags 1Data fine 5Less than 90 data lines in 15 minute averaging period 6No data present during 15 minute averaging period back WXT 510/CNR1 Mean Data File Convention Who: Duick Young 6 Aug 2007 File convention for data files stored in W:\KCLroof\YYYY\WXT510\MM\ File name structure LRYYYYDDD_15.txt. File Convention started 25th July 2007 (DOY 206) Flag (Column 27) added 3rd August 2007 (DOY 214) Tipping Bucket Raingauge added 18 August 2008 (DOY 231) Generated by: MATLAB using WXTmeanplot#.m Column Variable Units 1 Day of Year (DOY) 2 Decimal Time 3 Hour 4 Minute 5 Number of Samples 6 Wind Speed Minimum m s-1 7 Wind Speed Mean m s-1 8 Wind Speed Maximum m s-1 9 Air Temperature °C 10 Relative Humidity % 11 Air Pressure hPa 12 U (Wind Component) m s-1 13 V (Wind Component) m s-1 14 Wind Direction° 15 Total Rain Accumulation mm 16 Total Rain Durations 17 Total Hail Accumulation hits cm-2 18 Total Hail Durations 19 StDev – Wind Speed Minimum m s-1 20 StDev– Wind Speed Mean m s-1 21 StDev– Wind Speed Maximum m s-1 22 StDev– Air Temperature °C 23 StDev– Relative Humidity % 24 StDev– Air Pressure hPa Column Variable Units 25 StDev– U m s-1 26 StDev– Vm s-1 27 Flag 28 K¯ - Average W m-2 29 K¯- Standard Deviation W m-2 30 K↑ - Average W m-2 31 K↑- Standard Deviation W m-2 32 L¯- Average W m-2 33 L¯- Standard Deviation W m-2 34 L↑ - Average W m-2 35 L↑ - Standard Deviation W m-2 36 CNR1 Temperature – Average °C 37 CNR1 Temperature - Standard Deviation °C 38 CNR1 Temperature – Average K 39 CNR1 Temperature - Standard Deviation K 40 Net Radiation – Average W m-2 41 Net Radiation - Standard Deviation W m-2 42 UVA – Average μmol m-2 s-1 43 UVB – Average μmol m-2 s-1 44 Quantum (PAR) – Average μmol m-2 s-1 45 UVA – Average W m-2 46 UVB – Average W m-2 47 Quantum (PAR) – Average W m-2 48 UVA - Standard Deviation μmol m-2 s-1 49 UVB - Standard Deviation μmol m-2 s-1 50 Quantum (PAR) - Standard Deviation μmol m-2 s-1 51 Surface Albedo 52 Rain (Tipping Bucket) mm
back • TROUBLESHOOT • In case data have been collected by Roof8 or Roof3 but are missing on Otago, • grab data with: • D:\roof\co2\wxtGasGrabCeilAB_GetMissingData.m (latest version) • Adjust time settings in the code • Year • Month • Day • hour_orig (the first hour to be moved) • Nperiods (number of hourly periods in one day – run program separately for each day) • check file sizes are correct in • I:\YYYY\London\$site\WXT510\FORMAT_L0\WXTYYYYDOY_HH.txt • Rerun scripts on data01: /home/micromet/Roofprograms • WXT/WXTDataPro.R • WXT/PlotMetObs.sh • For radiation (CNR’s, SPN1, Eppleys, Skye) and ARG100 dataset • Rerun matlab program on Otago D drive:/Roof/Rad_Rain/RadRainNncdf.m • Rerun script at data02:/home/micromet/script/cronJobs/ -> mergeARG.sh and mergeRAD.sh