Download
1 / 3
30 likes | 112 Views
Learn how to sketch the graphs of trigonometric functions p(x), q(x), and r(x) and understand their symmetry and alterations based on the functions involved. Explore the reflection, compression, and behavior of these functions for different x values.

E N D
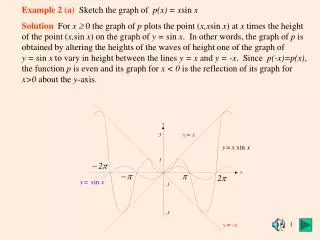
Example 2 (a)Sketch the graph of p(x) =xsin x SolutionFor x 0 the graph of p plots the point (x,xsin x) at x times the height of the point (x,sin x) on the graph of y = sin x. In other words, the graph of p is obtained by altering the heights of the waves of height one of the graph of y = sin x to vary in height between the lines y = x and y = -x. Since p(-x)=p(x), the function p is even and its graph for x < 0 is the reflection of its graph for x>0 about the y-axis.
(b)Sketch the graph of q(x) = sin 1/x. Solution Let u=1/x. For x > 0, the values of q(x) = sin 1/x for x small are the values of sin u for u large while the values of sin 1/x for x large are the values of sin u for u small. That is, all the waves of the graph of y = sin u for u large are compressed to the right of the y-axis in the graph of q. In addition, as u approaches 0 the values of sin u approach sin 0 = 0. Hence the values of sin 1/x approach zero as x gets large, i.e. the graph of q has the x-axis as a horizontal asymptote on the right. Note that q(-x)=-q(x), and q is an odd function. Hence the graph of q for x < 0, is the reflection of the graph of q for x > 0 about the origin.
(c)Sketch the graph of r(x) = x sin 1/x. Solution The graph of r(x) = x sin 1/x for x > 0 is obtained from the graph of q(x) = sin 1/x of (b) by altering the heights of the waves, as in (a), to vary between the lines y = x and y = -x. The behavior of this graph for x large will be explained in Section 1.6. Observe that r(-x) = r(x), i.e r is an even function. Therefore the graph for x < 0 is obtained by reflecting the graph for x > 0 about the y-axis. y=x y=-x