Download
1 / 19
190 likes | 362 Views
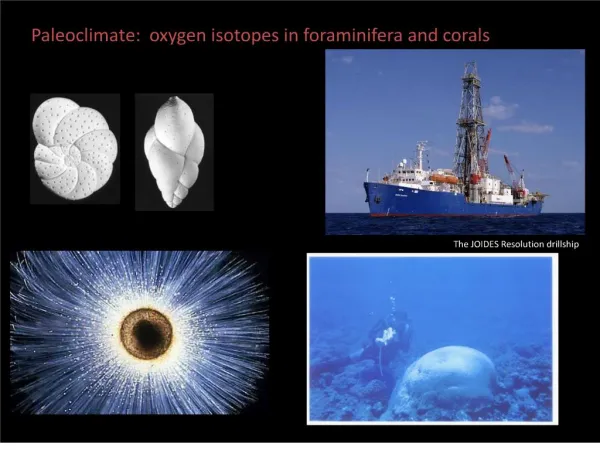
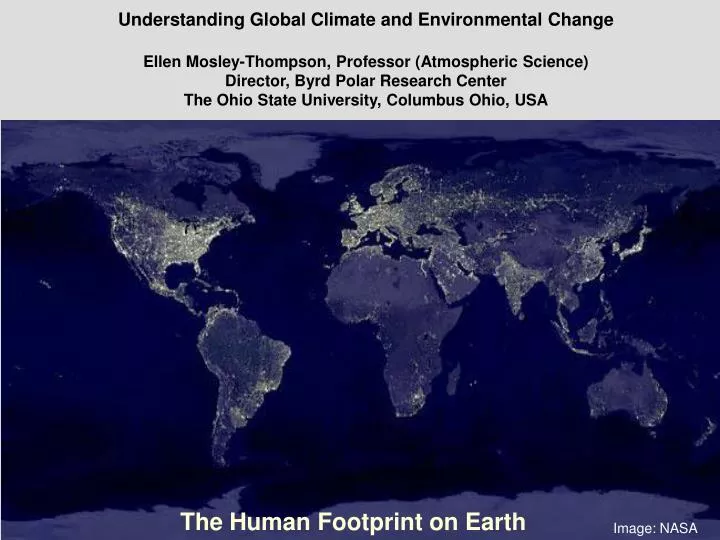
The Human Footprint on Earth. Understanding Global Climate and Environmental Change Ellen Mosley-Thompson, Professor (Atmospheric Science) Director, Byrd Polar Research Center The Ohio State University, Columbus Ohio, USA. Ice Core Paleoclimate Research Group

E N D
The Human Footprint on Earth Understanding Global Climate and Environmental Change Ellen Mosley-Thompson, Professor (Atmospheric Science) Director, Byrd Polar Research Center The Ohio State University, Columbus Ohio, USA Ice Core Paleoclimate Research Group Lonnie G. Thompson Henry Brecher Mary Davis Paolo Gabrielli Ping-Nan Lin Matt Makou Victor Zagorodnov Graduate Students: Liz Birkos Aron Buffen Natalie Kehrwald David Urmann Lijia Wei Funding provided by: NSF: Paleoclimate and Polar Programs NASA: Earth Sciences (Glaciology) NOAA: Paleoclimatology Gary Comer Foundation OSU Climate, Water & Carbon Program Image: NASA
2001-2007 Mean Surface Temperature Anomaly (◦C) Global .54 Global Temperature Change (ºC) .6 .4 .2 0 -.2 relative to the 1951-1980 mean -.4 relative to the 1951-1980 mean 1880 1900 1920 1940 1960 1980 2000 ºC Year A.D. Year A.D. Our Earth is warming! Climate is changing differently across the globe! Environmental conditions are changing! - some changes are unprecedented for thousands of years - some changes are occurring rapidly (years to decades) rapid changes can pose severe challenges for adaptation 2005 warmest year on record 0.75°C (◦C) http:www.giss.nasa.gov/research/news
Natural mechanisms influence climate Changes in the Sun Changes in the amount of volcanic aerosols in the atmosphere Internal variability of the coupled atmosphere-ocean system (e.g., ENSO, monsoon systems, NAO) Natural mechanisms
Human factors also influence climate Non-natural mechanisms Changes in the concentrations of atmospheric greenhouse gases Changes in aerosols and particles from burning fossil fuels (sulfate aerosols) and biomass (black carbon) Changes in the reflectivity (albedo) of the Earth’s surface Smoke from fires in Guatemala and Mexico (May 14, 1998)
3700 Dome C 850 EPICA Dome C ice core extends back through eight glacial and interglacial stages (800,000 years) recording changes in the composition of Earth's atmosphere CO2 remains in the atmosphere from 70 to 120 years Today: CO2 is 387 ppmv CH4 is 1800 ppbv 1800 387 800 600 400 200 0 Thousands of Years (B.P.) Carbon Dioxide & Methane Concentrations Past, Present and Future IPCC 2000 Scenario A1B for 2100 AD Today: CO2 is 378 ppmv CH4 is 1750 ppbv Lüthi et al.,Nature, May 15, 2008
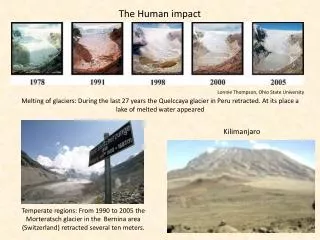
Many observed changes that are broadly consistent with an increase in the radiative heating of Earth’s surface and lower atmosphere • Recent and rapid melting of glaciers in non-polar regions around the world Climatologically we are in unfamiliar territory, and the world’s ice cover is responding dramatically.
Massive retreat of low-latitude glaciers today 2002 Gangapurna Glacier 1957 ~ 2 - 3 m thinning / year Courtesy Doug Burbank, UCSB
Quelccaya Ice Cap, Peru 1977 2002 L.G. Thompson, OSU L.G. Thompson, OSU
Kilimanjaro has lost 85% of its ice cover since 1912 Thompson et al., PNAS, 2009, in press, November issue
Many observed changes that are broadly consistent with an increase in the radiative heating of Earth’s surface and lower atmosphere • Recent and rapid melting of glaciers in non-polar regions around the world • Dramatic decreases in the areal coverage and thickness of Arctic sea ice - Increase in global ocean surface temperatures of 0.35°C since 1979 - warming evident at all latitudes over all ocean basins - to depths of at least 3000 meters - Decreases in the area covered by seasonally frozen ground in the high northern latitudes - Reduction by about 2 weeks of the annual duration of northern lake and river ice
Many observed changes are broadly consistent with an increase in the radiative heating of Earth’s surface and lower atmosphere - Rising sea level - Increases in atmospheric moisture content (increased evaporation) - Changes in extremes are consistent with warming - increase in heat waves globally - widespread increase in warm nights - rarer occurrences of cold days, cold nights and days with frost These many independent observations and the physical consistency among them form the basis for the 2007 conclusion by the Intergovernmental Panel of Climate Change (IPCC) that “warming of the climate is unequivocal”
“ Warming of the climate system is unequivocal” “Most of the observed increase in globally averaged temperatures since the mid-20th century is very likely* due to the observed increase in anthropogenic greenhouse gas concentrations.” * Very likely means 90% confidence A 3-year effort 152 authors (30 countries) > 600 reviewers Approved by 113 governments
observations Global and Continental Temperature Change from 1900 to 2000 AD natural forcings only natural and anthropogenic forcings IPCC Fourth AssessmentFebruary 2007
1000 1200 1400 1600 1800 2000 Year (A.D.) 5 IPCC 4th Assessment (2007) Projection for 2100 AD 2.0 – 4.5 oC 4 Global Temperature (°C) 3 2 Northern Hemisphere temperature (°C) for the last 1000 years N.H. Temperature (°C) 1 0.4 0 0 -0.4 -0.8 Year A.D..
Future energy policy will determine this This warming has already occurred 1000 1200 1400 1600 1800 2000 Year (A.D.) 5 Global average surface temperature is heading not only far outside the range of variation of the last 1000 years but outside the range experienced in the tenure of Homo sapiens on Earth. 4 Global Temperature (°C) 3 2 1 0.4 0 0 -0.4 -0.8 Year A.D..
Recent Assessments Report of the Committee on Environment and Natural Resources National Science and Technology Council May 2008 Report from U.S. Climate Change Science Program 2008 http://www.climatescience.gov/Library/sap/sap4-3/final-report/default.htm http://www.ostp.gov/galleries/NSTC Reports/Scientific Assessment FULL Report.pdf
Recent Assessment http://www.globalchange.gov/publications/reports/ scientific-assessments/us-impacts 2009