Aggregate Supply: Introduction & Determinants
280 likes | 463 Views
Aggregate Supply: Introduction & Determinants. Objectives:. What is the aggregate supply curve and what is the relationship between the aggregate price level and the quantity of aggregate output supplied in the economy?. 1929-1933. Sharp fall in aggregate demand Consequences:

Aggregate Supply: Introduction & Determinants
E N D
Presentation Transcript
Objectives: • What is the aggregate supply curve and what is the relationship between the aggregate price level and the quantity of aggregate output supplied in the economy?
1929-1933 • Sharp fall in aggregate demand • Consequences: • was a fall in the prices of most goods and services • Decline in the output of most goods and services • Surge in unemployment rate from 3% to 25%
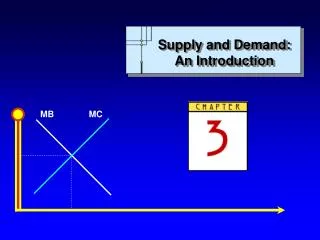
Aggregate Supply • Aggregate Supply Curve shows the relationship between the economy’s aggregate price level (overall price level of final goods and services in the economy) and the total quantity of final goods and services, or aggregate output, producers are willing to supply
The Short-Run Aggregate Supply Curve • 1929-1933 showed a positive relationship in the short run between the aggregate price level and the quantity of aggregate output supplied • A rise in the aggregate price level is associated with a rise in the quantity of aggregate output supplied, other things equal, a fall in the aggregate price level is associated with a fall in the quantity of aggregate output supplied, other things equal
The Short-Run Aggregate Supply Curve • Why does this relationship exist? • The price the producer receives for a unit of output is greater or less than the cost of producing that unit of output • Most of the costs producers face are fixed per unit of output and can’t be changed • Inflexible production costs is the wages paid to workers
The Short-Run Aggregate Supply Curve • Wages are typically inflexible production cost because the dollar amount of any given wage is often determined by contracts that were signed in the past • Nominal wage is the dollar amount of the wage paid • Sticky wages are nominal wages that are slow to fall even in the face of high underemployment and slow to rise even I the face of labor shortages • Nominal wages are not sticky forever
The Short-Run Aggregate Supply Curve • Many costs are fixed in nominal terms is the reason for the upward-sloping short-run aggregate supply curve • Perfectly competitive markets – producers take prices as given • Imperfectly competitive markets – producers have some ability to choose the price they charge • Both markets have a short-run positive relationship between prices and output
The Short-Run Aggregate Supply Curve • The short-run aggregate supply curve shows the relationship between the aggregate price level and the quantity of aggregate output supplied that exists in the short run, the time period when production costs can be taken as fixed
Shifts in the Short-Run Aggregate Supply Curve • Why does the short-run aggregate supply curve shift? • Producers make decisions based on their profit per unit of output
Shifts in the Short-Run Aggregate Supply Curve • Changes in Commodity Prices • Changes in Nominal Wages • Changes in Productivity
Changes in Commodity Prices • Changes in commodity prices • If commodity prices fall, . . . . . . short-run aggregate supply increases. • If commodity prices rise, . . . . . . short-run aggregate supply decreases.
Changes in Nominal Wage • Changes in nominal wages • If nominal wages fall, . . . . . . short-run aggregate supply increases. • If nominal wages rise, . . . . . . short-run aggregate supply decreases.
Changes in Productivity • Changes in productivity • If workers become more productive, . . . short-run aggregate supply increases. • If workers become less productive, . . . . short-run aggregate supply decreases
The Long-Run Aggregate Supply Curve • The long-run aggregate supply curve shows the relationship between the aggregate price level and the quantity of aggregate output supplied that would exist if all prices, including nominal wages, were fully flexible. • In the long run, nominal wages – like the aggregate price level – are flexible, not sticky
The Long-Run Aggregate Supply Curve • What would happen if you could all prices in the economy? • All prices = prices of all inputs, including nominal wages, prices of final goods and services • What would happen to aggregate output, given that the aggregate price level has been halved and all input prices, including nominal wages, have been halved?
The Long-Run Aggregate Supply Curve • NOTHING! • Each producer would receive a lower price for its product, but costs would fall by the same proportion • Every unit of output profitable to produce for the change in prices would still be profitable to produce after the change in prices
Aggregate supply curve is vertical because changes in the aggregate price level have no effect on aggregate output in the long run Potential output is the level of real GDP the economy would produce if all prices, including nominal wages, were fully flexible
Potential Output • In reality, the actual level of real GDP is almost always either above or below potential output
Potential Output • What caused the rightward shifts? • Increases in the quantity of resources, including land, labor, capital, and entrepreneurship • Increases in the quality of resources, as with a better-educated workforce • Technological progress
Short Run to Long Run At P1, quantity of aggregate output supplied, Y1, exceeds potential output, Yp. Low unemployment will cause nominal wages to rise….
Short Run to Long Run At P1, quantity of aggregate output supplied, Y1, is less than potential output, Yp. High unemployment will cause nominal wages to rise….