Download
1 / 25
250 likes | 373 Views
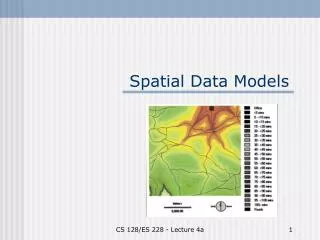
Spatial and Computational Models of Risks for Alcohol Users. Edward J. Wegman University of Cambridge and George Mason University Joint work with Yasmin H. Said and William F. Wieczorek. Agenda. Spatial Statistics and GIS Risk Factors and Social Indicators Erie County, New York Risk Factors

E N D
Spatial and Computational Models of Risks for Alcohol Users Edward J. Wegman University of Cambridge and George Mason University Joint work with Yasmin H. Said and William F. Wieczorek
Agenda • Spatial Statistics and GIS • Risk Factors and Social Indicators • Erie County, New York Risk Factors • Multivariate Visualization • Spatial Analysis using CCMaps
Spatial Statistics and GIS • Statistical methods are often used in health studies including alcohol studies in order to confirm hypotheses about health risks. • These relatively elementary techniques do not exploit the broader newer methods of multivariate data visualization and spatial statistics. • The ability to manipulate multivariate spatial data offers the possibility of extracting additional meaning and suggests not only the possibility of a confirmatory role for statistical methods, but also an exploratory role.
Spatial Statistics and GIS • Statistical spatial analysis often begins with spatial analysis using a geographic information systems (GIS). • Such systems allow the analysis of distance and connectivity including: • The measures of distances between points and between points and centroids, analysis of adjacency, analysis of networks including roads and other transportation systems, and analysis of buffer areas between otherwise adjacent areas. • Spatial analysis of this sort can give insight into effective distances which may be substantially different from apparent Euclidean distances.
Spatial Analysis and GIS • Spatial dependencies define the relationships among spatially diverse entities, including non-random patterns in geographic space, clusters, dispersion, and spatial autocorrelation. • Spatial factors are integral to the development of alcohol simulation models such as those presented in the previous talk by Dr. Said. • Spatial analysis contributes to hypothesis generation, spatial epidemiology, multi-level/multi-resolution modeling, spatial interaction and travel models, and understanding spatial processes in small areas. • The latter capability allows the development and testing of psychosocial models, especially with respect to spatial interactions among alcohol and drug users.
Risk Factors and Social Indicators • Traditionally, health studies, including alcohol studies, collect data by surveys which provide data at the individual level. • It is not always possible to collect data at the individual level because of cost, privacy, or lack of resources. • In many situations it is impractical or impossible to measure a specific outcome such as early drinking, adolescent drug use, or alcohol dependence. • In contrast, information may be easily available on factors associated with these phenomena such as poverty, immigration status, language facility, and alcohol availability.
Risk Factors and Social Indicators • Social indicators are numerical data, usually archival in nature, that measure the well-being of a population. • There are frequently issues of data quality including reliability and validity. • Is the indicator a stable measure? • Is the indicator actually related to the phenomenon of interest? • The advantage of using social indicator data include: • The use of substantial amounts of administratively available data, • The ability to make data-driven decisions on topics that are impractical to measure directly, • The fact that specific indicators have conceptual and evidential relationship to difficult to measure outcomes.
Risk Factors and Social Indicators • Disadvantages of using social indicator data include: • The fact that data are collected for purposes other than their use as indicator, hence, may not have statistical validity, • That there are few direct indicators (relationships of indicator to outcome are indirect), • That are few indicators at local geographic level (postal code or census tract, most are at county, state, or national levels), and • That there are a huge number of indicators from which to select many of which may be overlapping and collinear.
Risk Factors and Social Indicators • Social indicators provide an indirect method of needs assessment for public health services. • They show relative need for services and may be used to estimate actual need for services in some situations. • In addition coupled with demographic information, social indicator analysis allows for tailoring services to population characteristics.
Risk Factors and Social Indicators • Indicators can fall into a number of categories including neighborhood indicators, family indicators, and individual indicators. • Neighborhood indicators would include: • Availability of drugs and firearms, community attitudes toward laws and social norms, attitudes favorable to drug use, firearms and crime, state of transition and mobility within the neighborhood, levels of neighborhood attachment, and community disorganization. • Family-level indicators include: • Extreme economic privation, family history of problem behaviors, family management problems, family conflict, and lack of commitment to schools. • Individual indicators include: • Alienation and rebelliousness, early academic failure, substance abuse, delinquency, lack of parental involvement in problem behaviors, and teen pregnancy.
Erie County Risk Indicators • Wieczorek and Delmerico (2005) assembled a database of risk indicators for Erie County, NY using several sources. • Erie County includes the city of Buffalo, New York. This database provides a data-rich snapshot of a relatively small county-level geographic area. • The sources include U.S. Census 2000, New York State Education Department, New York state Department of Criminal Justice Services. • At the local level, sources include the Center for Health and social Research, City of Buffalo Police Department, Erie County Board of elections, Erie County Department of Health, Erie County Department of Mental Health, and the Roswell Park Cancer Institute.
Erie County Risk Indicators • Because all indicators are essentially ratios of the form cases/population (expressed as percent or per 10,000), it is important to avoid unreliable indicator values due to small populations. • For this reason an arbitrary threshold of population greater than 100 was set. Records for zip codes and tracts with populations below 100 have been removed from the database. • Sometimes the source data for calculation of the indicators were available at a spatial level other than census tract or zip code area. • In these cases risk indicators were first calculated at the available level, and then imputed to the zip level. The imputation was performed using population-based weighting method.
Multivariate Analysis • Alcohol use and abuse can be thought of in terms of both a cause and an effect. • Alcohol use and abuse is a cause insofar as it leads to acute outcomes such as DWI/DUI, DWI with fatal crashes, assault, domestic violence, child abuse, sexual assault, murder, suicide as well as chronic outcomes such as cirrhosis of the liver and other alcohol induced diseases.
Multivariate Analysis • Some social indicators for these outcomes from the Erie County Risk Indicators Database include: • crm.dwi (DWI crime), • de.traffic (fatal crash deaths), • crm.viol (violent crime), • de.trauma (trauma deaths), • jar.viol (juvenile crime), • crm.drug (drug-related crimes), • de.suicide (suicide deaths), and • de.cirrohsis (cirrhosis deaths).
Multivariate Analysis • Conversely, alcohol use and abuse can be thought of as being caused by • poverty, • marital unhappiness, • poor education, • drug and alcohol availability, • neighborhood factors, • parental alcoholism, and • ethnicity issues.
Multivariate Analysis • Some social indicators in the Erie County Risk Indicators Database include: • fam.pov (family poverty), • med.income (median income), • unem (unemployment), • divorce (divorce rates), • nv.married (never married), • edu.g8 (education below 8th grade level), • edu.col.d (educated beyond college), • dropout (dropout rates), • alc.all (all alcohol outlets), • alc.off (off license outlets), • tobacco (tobacco outlets), • vacant (neighborhood vacancies), • vote.gen (general voting registrations) and • poor.eng (poor household English usage rates).
Multivariate Analysis • An indicator of overall alcohol problems for Erie County is the rate of admissions to treatment for alcoholism and substance abuse. • The appropriate indicator is oasas.18ov, which is the rate per 10,000 by zip code for individuals over the age of 18.
Acknowledgements • The work of Dr. Wegman is supported in part by the U.S. Army Research Office under contract W911NF-04-1-0447. • The work of Dr. Said is supported in part by grant number F32AA015876 from the National Institute on Alcohol Abuse and Alcoholism. • The work of Dr. Wieczorek is supported in part by grant number R01AA016161 from the National Institute on Alcohol Abuse and Alcoholism and by a contract from Western New York United Against Alcohol and Drug Abuse/Erie County Department of Mental Health. • The content is solely the responsibility of the authors and does not necessarily represent the official views of the National Institute on Alcohol Abuse and Alcoholism or the National Institutes of Health. • Drs. Wegman and Said were Visiting Fellows at the Isaac Newton Institute for Mathematical Sciences at the University of Cambridge in Cambridge, England. We are indebted for the support provided by the Newton Institute, which has made the successful completion of this work possible.
Contact Information • Edward J. Wegman • ewegman@gmail.com • (703) 993-1691 • Yasmin H. Said • ysaid99@hotmail.com • (301) 538-7478 • William F. Wieczorek • wieczowf@buffalostate.edu • (716) 878-6137