Download
1 / 39
390 likes | 554 Views
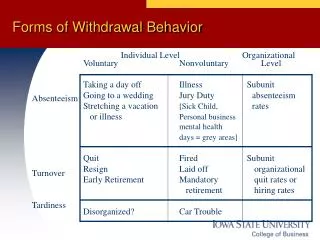
Forms of Withdrawal Behavior. Individual Level Organizational. Voluntary Nonvoluntary Level Taking a day off Illness Subunit Going to a wedding Jury Duty absenteeism Stretching a vacation [Sick Child, rates or illness Personal business

E N D
Forms of Withdrawal Behavior Individual Level Organizational Voluntary Nonvoluntary Level Taking a day off Illness Subunit Going to a wedding Jury Duty absenteeism Stretching a vacation [Sick Child, rates or illness Personal business mental health days = grey areas] Quit Fired Subunit Resign Laid off organizational Early Retirement Mandatory quit rates or retirement hiring rates Disorganized? Car Trouble Absenteeism Turnover Tardiness
Why be concerned with absenteeism? • Absenteeism is on the rise • Cost of Absenteeism is high (example) • Affect on customer service • Affect on employee morale and productivity
Example of cost of Absenteeism* • Salary ($12.46/hour for 8 hours) $ 99.70 • Benefits 28.12 • Replacement Employee training etc 10.23 • Unabsorbed Burden(rent, lights etc) 67.75 • Lost profit contribution 81.81 • Total cost of absence $287.61 *lower level employee, 2007
Causes of Absenteeism Type of Reason 1995 1998 2002 Absence Illness 45% 22% 33% NonVol Family Issues/business? 27% 26% 24% Gray area Personal Needs 13% 20% 21% Vol. Entitlement 9% 10% 10% Vol. Stress Related 6% 16% 12% Vol.
Measuring Absenteeism • Frequency Measure • Severity Measure • Attitudinal Measure • Medical Measure • Blue Monday • Worst Day
Measuring Absenteeism: example February S M T W R F S 1 2 3 4 5 6 7 8 9 10 11 12 13 14 15 16 17 18 19 20 21 22 23 24 25 26 27 28 March S M T W R F S 1 2 3 4 5 6 7 8 9 10 11 12 13 14 15 16 17 18 19 20 21 22 23 24 25 26 27 28 29 30 31 April S M T W R F S 1 2 3 4 5 6 7 8 9 10 11 12 13 14 15 16 17 18 19 20 21 22 23 24 25 26 27 28 29 30
A Model of Employee Attendance • 3.Personal Characteristics • Org. Tenure - Family Size • Age - Personality • Sex • 7.Ability to Attend • - Illness/accidents • Family Responsibilities • Transportation Problems • Travel Distance 2.Job Expectations (Including about attendance) Recruitment & Selection 1.Job Situation -Job Autonomy -Job Level -Work Group Size -Role Stress -Leader Style - Co-worker Relations -Flexible Scheduling 4. Job Attitudes -Job Satisfaction -Organizational Commitment -Job Involvement 6.Attendance Motivation 8.Employee Attendance 5.Pressures to Attend -Economic/Market Conditions -HR Practices (Incentives/Controls) -Work Group Norms/Culture -Profit Sharing/Employee Ownership
How Companies Fight Absenteeism Percentage of Companies using Program Programs Effectiveness of Program (1-5 scale) 89% Disciplinary Action Yearly Review Illness Verification PTO Bank No Fault Personal recognition Buy Back/Well pay Bonus 3.4 82% 2.9 74% 3.2 60% 3.6 59% 2.9 57% 2.6 53% 3.4 51% 3.3 CCH: www.cch.coom/press/news/2007
A Systematic View of Reducing Absenteeism • Simplify Absenteeism • Increase Relevant Attitudes • Motivation Programs • Change the Nature of the Control System • Encourage Physical Health • Put Someone in Charge
Why be interested in Turnover? • Changing Economic Trends • Changing Demographic Trends • 3. Changing Employment Patterns • 4. Affect on Customer Satisfaction • 5. Cost of Turnover
Cost of T/O: Entry level Fortune 500 example 1984 1998 2008 Replacement Acquisition - Direct Hiring Costs $638 $ 1001 $1062 - Other Hiring Costs 403 632 670 Replacement Training - Pre-assignment 1646 2583 2740 - Learning Curve 462 725 769 (MCI study: new hire can accomplish only 60% as much in first 3 months. Journal of Accountancy estimates rookie efficiency equals 1/3 of the cost of T/O Other Costs - Unabsorbed burden 1481 2324 2466 - Lost Profit Contribution 843 1323 1404 Total Costs $5473 $8588 $9,111 2008 is based on entry level salary of $45,555
Cost of T/O by Company and Position Company Position Cost Automobile Manufacturer HR Manager $133,688 Machine Works Salaried Machinist $102,376 Hourly Machinist $58,564 Insurance Manager $79,672 Software Project Leader $32,160 Systems Engineer $34,365 Fast-Food Chain Store Manager $20,765 Counter Person $1,204 Source: Kepner & Tregoe, Bulletin to Management, 6-17-99, Jan. 1999
T/O Rates Among Fortune’s 100 Best Cos Est. T/O cost Reducing T/O 1% Company T/O Rate per Employee est. savings/year Merck 9% $7592 $2,765,000 Cerner 14% $8000 $240,000 Charles Schwab 12% $8329 $1,512,000 MBNA 15% $4800 $1,000,000 America Bank Avg. U.S. Co. 15.6% $5000 $500,000 Data from Fortune’s 100 Best Companies to Work For, Jan 2001 Est. T/O costs calculated at 20% of common entry level salary.
T/O Rates Vary Considerably: ex. Mental Health HR Assistant Secretary Maintenance Worker Driver Therapist Cook Case Manager Teachers Behavior Health Tech. Teacher’s Aide Supervisor Clinical Director Accountant HR Manager Controller Executive Director 66% 14% 200% 27% 0% 34% 40% 47% 92% 16% 60% 36% 100% 33% 60% 0%
Firms with lowest T/O rates 2008 Rank, Best Company Co. to work for % T/O S.C. Johnson 27 2 Herman Miller 96 3 Alcon Laboratories 60 3 Cisco Systems 6 4 So. Ohio Med Ctr 75 4 General Mills 69 4 SAS Institute 29 5 Mayo Clinic 59 5
Forms of T/O • Non-voluntary • Voluntary • Functional • Dysfunctional • Gray Area
How do we measure T/O? • Separation Rate • Instability Rate • Wastage Rate • Average Length of Service
Managing Turnover Effect of T/O on the Org. Functional Dysfunctional Voluntary NonVoluntary Motivation for the T/O
Forms of T/O: example of nurses Turnover 14.6% Voluntary 87% Nonvoluntary 13% Functional 42% Dysfunctional 58% (7.37% of T/O)
A Model of Employee Turnover • 3.Personal Characteristics • Org. Tenure - Family Size • Age - Personality • Sex - Other (experience etc) • 7.Pressures to Leave • Perceived job availability • Low job performance 2.Job Expectations - Realistic Job Previews 1.Job Situation -Job Enrichment -Task Repetitiveness -Work Group Size -Role Stress -Leader Style -Co-worker Relations -Flexible Scheduling 4. Job Attitudes -Job Satisfaction -Organizational Commitment -Job Involvement 6.Job Search Motivation 8.Employee Turnover 5.Pressures to Stay -Economic/Market Conditions -HR Practices (Incentives/Controls) -Union Presence -Profit Sharing/Employee Ownership
Pre-employment predictors of T/O • Prior T/O behavior • Time (months) on prior job • Employee referral • # friends/family in present organization • “overt” intent to stay • Desire for the job
Effect of RJPs on T/O 40% Sewing Machine Operators West Point Cadets Telephone Operators Insurance Agents Bank Tellers US Marines Nurses 11.1% 11.5% 6% 50% 33.8% 27% 19% 35% 15% 33.1% 22.4% 21.1% 8.5% 0 10 20 30 40 50 Turnover Rates = Control Group = RJP Group
Job performance and T/O • Low performers quit more than • high performers • Low and high performers quit more than • average performers.
Summary of Strategies for Managing Turnover • Promote Job Designs that reduce T/O (Box 1) • Encourage Small Group Sizes (Box 1) • Reduce Job Stress (Box 1) • Improve HR skills of Supervisors (Box 1) • Clarify Job Expectations (Box 2) • Use pre-employment techniques to hire more carefully • Improve Placement to Emphasize Person-Job Fit (Box 3) • Address non-work causes of turnover (EAPs) (Box 3) • Promote Job Satisfaction (Box 4) • Promote Organizational & Job Commitment (Box 4) • Combat Non-work causes of T/O as • long as economical (Box 5)
Important Issues to Consider: Summary • Need to differentiate between voluntary and • nonvoluntary turnover. • Are voluntary leavers leaving for work or non-work • related reasons? • Need to ascertain who quits. • What is the impact of T/O on those who remain? • T/O is not to be eliminated, but managed.
Positive and Negative Consequences of T/O Positive Consequences Negative Consequences Lose low performers Lose high performers Cost savings (new hires cheaper) Costly Stimulate changes in policies Negative PR from leavers Increased satisfaction among stayers Decreased satisfaction Increased internal mobility opportunities Increased workload Infusion of new knowledge/change Decreased cohesion Decrease in other withdrawal behavior Disrupted social/comm. patterns
Stress Stress occurs when an individual cannot adequately respond to job or organizational stimuli without damage or excessive wear and tear on their system (fatigue, worry, heart disease).
Reasons for Studying Stress • Economic Self-Interest • Legal Reasons/Liability/Worker’s Compensation • Moral, Ethical, Humanistic Reasons
General Adaptation Syndrome (Hans Selye) Instrumental Functioning Resistance Exhaustion Alarm Stress
Occupations and Stress High Stress Low Stress Inner City H.S. Teacher Farm Laborer (nonowner) Police Officer Maid Miner Craft Worker Air Traffic Controller Animal/stock Handler Medical Intern Heavy Equip. Operator Stockbroker College Professor Journalist Customer Complaint Clerk Waitress Secretary
Sample of 250 Jobs Rated for Stress • High Stress Low Stress • U.S. President 103. Market Researcher • Fire Fighter 119. Economist • Senior Executive 122. Mechanical Engineer • Surgeon 149. Retail Sales Person • Air Traffic Controller 173. Computer Programmer • PR Executive 193. Purchasing Agent • 20. Stockbroker 245. Actuary
Common Factors for High Stress Jobs • Little control over work • Major responsibility for human/financial resources • Unpleasant working conditions • Repeated exchanges with others • Unstructured as opposed to structured tasks
Types of Role Stress • Role Conflict • Intrasender Conflict • Intersender Conflict • Interrole Conflict • Person Role Conflict Role Ambiguity Role Overload Quantitative Overload Qualitative Overload Role Underutilization Resource Inadequacy
Type A and Type B Personalities Type A Type B Excessive competitiveness Feels no need to display or Tries to stretch abilities, even in discuss achievements social situations Impatient Patient Sense of time urgency Unhurried in work or manner Invests long hours on the job Can relax without guilt Tries to do several things at once More reflective Seldom expresses feelings of anxiety Exhibits concern for broad Seldom afflicted with minor illnesses ramifications of decisions If exercise at all, plays 36 holes of Plays for fun and relaxation, golf; takes a stop watch jogging not just to win
Stress and Performance Traditional View Current View Performance Distress Eustress Distress Stress Stress Source: adapted from Quick & Quick, Organizational Stress and Preventative Management (New York: McGraw-Hill, 1984, P. 7 & 12)
Approaches to Stress Management • Dissipation • Selection and Training • Training • Job Design
Health/Life Style Programs “Carrot” vs “Stick” approaches HyVee reduction in health insurance for nonsmokers GuideOne reductions in health insurance for nonsmokers and drinkers and extra coverage for those who volunteer and have regular church attendance Gannett, General Mills, NW Airlines monthly surcharge for smokers not attending cessation programs U-Haul International Biweekly health insurance surcharge for tobacco use or excessive weight
Current Wave: Smokers Smoking on decline in US, but still 23% of Iowans smoke Center for Disease Control estimates smoking costs the nation $167 billion. Federal studies show smokers cost businesses an average of $5606 more per year due to increased medical and absences Over a lifetime, employees who smoke incur $16,000 more in medical bills.
Next wave: Obesity 1 in 3 adults is obese (BMI >30) Obesity costs the nation $100 billion. Obesity accounts for 5-7% of health care costs For a co. of 1000 employees, an extra $395,000. Programs to combat obesity are on the rise. (Google, Caterpillar putting healthier food in vending, charging less for healthier food in cafeterias) Alabama charges $25/mo more for insurance if obese (BMI>35) Source: Conference Board, 2008