Download
1 / 55
560 likes | 687 Views
General Prediction Strength Methods for Estimating the Number of Clusters in a Dataset. Moira Regelson, Ph.D. September 15, 2005. Motivation. k -means (medoids) clustering will happily divide any dataset into k clusters, regardless of whether that’s appropriate or not. Overview.

E N D
General Prediction Strength Methods for Estimating the Number of Clusters in a Dataset Moira Regelson, Ph.D. September 15, 2005
Motivation • k-means (medoids) clustering will happily divide any dataset into k clusters, regardless of whether that’s appropriate or not.
Overview • Review of previous methods • Re-formulation and extension of Tibshirani’s prediction strength method • Contrast results for different cluster configurations • Application to gene co-expression network
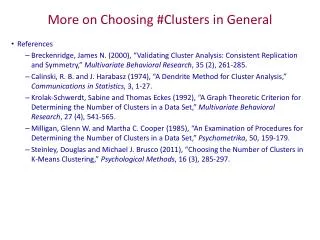
Different Methods for Deciding Number of Clusters • Methods based on internal indices • Depend on between- and within- sum of squared error (BSS and WSS) • Methods based on external indices • Depends on comparison between different partitionings • Evaluate indices for different values of k and decide which is “best”
Internal Indices • Calinski & Harabasz • Hartigan • Krzanowski & Lai • n=number of samples • p=dimension of samples
Calinski and Harabasz (1974) • For each number of clusters k ≥ 2, define the index • The estimated number of clusters is the k which maximizes the above.
Hartigan • For each number of clusters k ≥ 1, define the index • The estimated number of clusters is the smallest k ≥ 1 such that Ik ≤ 10.
Krzanowski and Lai (1985) • For each number of clusters k ≥ 2, define the indices • The estimated number of clusters is the k which maximizes Ik.
The silhouette width method (Kaufman and Rousseeuw, 1990) • Silhouettes use average dissimilarity between observation i and other observations in the same cluster. • Silhouette width of the observation is • ai = average dissimilarity of observation i • bi = minimum dissimilarity within the cluster
The silhouette width method (cont.) • Overall silhouette width is the average over all observations: • The estimated number of clusters is the k for which Ik is maximized.
Gap (uniform) or Gap(pc) (Tibshirani et al., 2000) • For each number of clusters k, • B reference datasets generated under null distribution.
Gap statistic (cont.) • Estimated number of clusters is smallest k≥ 1 that maximizes Ik and satisfies • sk = standard deviation over reference datasets. • Uniform gap statistic samples from a uniform distribution • “pc” (principal component) statistic samples from a uniform box aligned with the principal components of the dataset (Sarle, 1983).
External Indices/Approaches • Comparing Partitionings • Rand Index • Tibshirani • Clest • General Prediction Strength
Comparing Partitionings: The Contingency Table • Partitionings U={u1,..., uR} and V = {v1,..., vS} of n objects into R and S clusters
Comparing Partitionings: The Contingency Table • nrs = number of objects in both urand vs.
Comparing Partitionings: The Contingency Table • = total points in cluster ur • = total points in cluster vs
Rand Index (Rand, 1971, Hubert and Arabie, 1985) • Rand index and adjusted Rand index (m=2)
Clustering as a supervised classification problem • Input data split repeatedly into a training and a test set for a given choice of k (number of clusters) • Clustering method applied to the two sets to arrive at k “observed” training and test set clusters. • Use the training data to construct a classifier for predicting the training set cluster labels. • Apply classifier to test set data -> predicted test set clusters. • Measure of agreement calculated based on the comparison of predicted to observed test set clusters (external index).
Predicting the number of clusters • Use cluster reproducibility measures for different k to estimate the true number of clusters in the data set. • Assumes that choosing the correct number of clusters -> less random assignment of samples to clusters and to greater cluster reproducibility.
Tibshirani Prediction Strength (Tibshirani et al., 2001) • Specify kmax and max number of iterations, B. • For k in {2…kmax}, repeat B times: • Split data set into a training set and a test set • Apply clustering procedure to partition training set into k clusters, record cluster labels as outcomes. • Construct classifier using training set and cluster labels. • Apply resulting classifier to test set ->“predicted” labels. • Apply the clustering procedure to the test set to arrive at the “observed” labels. • Compute a measure of agreement (external index) ps1(k,b) comparing the sets of labels obtained in steps 4 and 5.
Tibshirani PS (cont.) • Switch the role of the test and training sets to arrive at another estimate of the index, ps2(k,b). • Use ps1(k,b) and ps2(k,b) to compute the mean value, ps(k,b) = (ps1(k,b)+ ps2(k,b))/2, and standard error, se(k,b) = |ps1(k,b)- ps2(k,b)|/2. Use these to define pse(k,b) = ps(k,b)+se(k,b) = max(ps1(k,b), ps2(k,b)).
Tibshirani PS (cont.) • pse(k) = median of pse(k,b) over all random splits • Values of pse(k) used to estimate the number of clusters in the dataset using a threshold rule
Clest (Dudoit and Fridlyand, 2002) • Step “A” identical to steps 1-6 of Tibshirani PS. Denote external indices computed in step A.6. by (sk,1, sk,2,…sk,B). Then • Let tk= median(sk,1, ..., sk,B) denote observed similarity statistic for the k-cluster partition of the data. • Generate B0 datasets under null hypothesis of k=1. Briefly, for each reference dataset, repeat the procedure described in steps A and B above, to obtain B0 similarity statistics tk,1, ..., tk,Bo. • Let denote average of the B0 statistics • Let dk = tk- denote the difference between the observed similarity statistic and estimated expected value under null hypothesis of k = 1.
General Prediction Strength • Re-formulation of Tibshirani PS • Extension to m-tuplets
Tibshirani re-formulation • Originally, measure of agreement formulated as • Note: partitioning around medoid (PAM) clustering used
General Prediction Strength • Re-formulation of Tibshirani PS & extension to m-tuplets: • Add a standard error in cross-validation: PSE(k,m) used with threshold. • Intuitive interpretation: fraction of m-tuplets in test set that co-cluster in the training set
Asymmetry in PS • Difference between Rand index and PSE(k,m): • Rand = 0.95, adjusted Rand = 0.86. • PSE(k,m=2) = 0.17, but when role of U and V reversed, PSE(k,m=2) = 0.83.
Simulations • A single cluster containing 200 points uniformly distributed from (-1,1) in 10-d. • Three normally distributed clusters in 2-d with centers at (0,0). (0,5), and (5,-3) and 25, 25, and 50 observations in each respective cluster. • Four normally distributed clusters in 3-d with centers randomly chosen from N(0, 5*I) and cluster size randomly chosen from {25, 50}. • Four normally distributed clusters in 10-d with centers randomly chosen from N(0, 1.9*I) and cluster size randomly chosen from {25, 50}. In 3 & 4, simulations with clusters with minimum distance less than one unit were discarded.
Simulations • Two elongated clusters in 3-d. Generated by choosing equally spaced points between (-0.5, 0.5) and adding normal noise with sd 0.1 to each feature. Then add 10 to each feature of the points in the second cluster. • 100 points per cluster • 200 points per cluster (to illustrate effects of an increased number of observations)
Results of Simulations • PS performs consistently well • Not all values of m perform equally well in all the simulations (m=3 and m=5 do best overall) • Performance especially noticeable on elongated cluster simulation. • Clest performs comparably to PS. • Of internal index methods, Hartigan seems least robust • Calinski and Kraznowski-Lai indices and the silhouette width method cannot predict a single cluster.
DNA Microarrays • Expression level of thousands of genes at once • Lots of processing and normalization
Use of Microarrays • Within an experiment use “normal” and “diseased” cell types (e.g.). • Generally examined for differences in expression levels between cell types. • Look for genes that characteristically vary with disease.
Gene co-expression network • Use DNA microarray data to annotate genes by clustering them on the basis of their expression profiles across several microarrays. • Studying co-expression patterns can provide insight into the underlying cellular processes (Eisen et al., 1998, Tamayo et al., 1999).
Building a network • Use Pearson correlation coefficient as a co-expression measure. • Threshold correlation coefficient to arrive at gene co-expression network.
Building a network (cont.) • Node corresponds to expression profile of a given gene. • Nodes connected (aij=1) if they have significant pairwise expression profile association across perturbations (cell or tissue samples).
Topological Overlap Matrix • TOM given by (Ravasz et al, 2002) • ki is the connectivity of node i:
TOM (cont.) • ij= 1 if the node with fewer links satisfies two conditions: • all of its neighbors are also neighbors of the other node and • it is linked to the other node. In contrast, • ij = 0 if nodes i and j are unlinked and the two nodes have no common neighbors. • similarity measure, associated dissimilarity measure dij = 1- ij.
Gene Co-Expression Network for Brain Tumor Data • Brain tumor (glioblastoma) microarray data (previously described in Freije et al (2004), Mischel et al (2005), and Zhang and Horvath (2005)). • Network constructed using correlation threshold of 0.7 and the 1800 most highly connected genes.
Gene Co-Expression Network for Brain Tumor Data (cont.) • Used PS method (with PAM) on TOM with m=(2,5,10) • m=2, m=5 -> 5 clusters • Same as Mischel et al. • m=10 -> 4 clusters • Reasonable interpretation?
Classical Multi-Dimensional Scaling • Used to visualize abstract TOM dissimilarity • “Principal component analysis”
Inspection of Heatmap • Red for highly expressed genes • Green for low expression • Consistent expression across genes (rows) in clusters => Either 4 or 5 clusters justified
Conclusion • There are several indices for evaluating clusterings • External compare different partitionings, internal do not • Indices can be used to predict number of clusters • Prediction Strength index method works across different cluster configurations • Fairly simple and intuitive • Effective on elongated clusters • Results of varying m reflect hierarchical structure in data
Acknowledgements • Steve Horvath • Meghna Kamath • Fred Fox and Tumor Cell Biology Training Grant (USHHS Institutional National Research Service Award #T32 CA09056) • Stan Nelson and the UCLA Microarray Core Facility • NIH Program Project grant #1U19AI063603-01.
References • http://www.genetics.ucla.edu/labs/horvath/GeneralPredictionStrength. • CALINSKI, R. & HARABASZ, J. (1974). A dendrite method for cluster analysis. Commun Statistics, 1-27. • DUDOIT, S. & FRIDLYAND, J. (2002). A prediction-based resampling method for estimating the number of clusters in a dataset. Genome Biol3, RESEARCH0036. • EISEN, M. B., SPELLMAN, P. T., BROWN, P. O. & BOTSTEIN, D. (1998). Cluster analysis and display of genome-wide expression patterns. Proc Natl Acad Sci U S A95, 14863-8. • FREIJE, W. A., CASTRO-VARGAS, F. E., FANG, Z., HORVATH, S., HARTIGAN, J. A. (1985). Statistical theory in clustering. J. Classification, 63-76. • HUBERT, L. & ARABIE, P. (1985). Comparing Partitions. Journal of Classification2, 193-218. • KAUFMAN, L. & ROUSSEEUW, P. J. (1990). Finding groups in data: an introduction to cluster analysis. New York: Wiley. • KRZANOWSKI, W. & LAI, Y. (1985). A criterion for determining the number of groups in a dataset using sum of squares clustering. Biometrics, 23-34. • MISCHEL, P., ZHANG, B., CARLSON, M., FANG, Z., FREIJE, W., CASTRO, E., SCHECK, A., LIAU, L., KORNBLUM, H., GESCHWIND, D., CLOUGHESY, T., HORVATH, S. & NELSON, S. (2005). Hub Genes Predict Survival for Brain Cancer Patients. • RAND, W. M. (1971). Objective criteria for the evaluation of clustering methods. Journal of the American Statistical Association, 846-850. • RAVASZ, E., SOMERA, A. L., MONGRU, D. A., OLTVAI, Z. N. & BARABASI, A. L. (2002). Hierarchical organization of modularity in metabolic networks. Science297, 1551-5. • SARLE, W. (1983). Cubic Clustering Criterion. SAS Institute, Inc. • TAMAYO, P., SLONIM, D., MESIROV, J., ZHU, Q., KITAREEWAN, S., DMITROVSKY, E., LANDER, E. S. & GOLUB, T. R. (1999). Interpreting patterns of gene expression with self-organizing maps: methods and application to hematopoietic differentiation. Proc Natl Acad Sci U S A96, 2907-12. • TIBSHIRANI, R., WALTHER, G., BOTSTEIN, D. & BROWN, P. (2001). Cluster validation by prediction strength. Stanford. • TIBSHIRANI, R., WALTHER, G. & HASTIE, T. (2000). Estimating the number of clusters in a dataset via the gap statistic. Department of Biostatistics, Stanford. • YEUNG, K. Y., HAYNOR, D. R. & RUZZO, W. L. (2001). Validating clustering for gene expression data. Bioinformatics17, 309-18. • ZHANG, B. & HORVATH, S. (2005). A General Framework for Weighted Gene Co-Expression Network Analysis. Statistical Applications in Genetics and Molecular Biology.