Download
1 / 17
170 likes | 259 Views
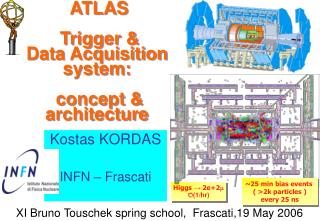
Sander Klous on behalf of the ATLAS Collaboration Real-Time May 2010. Resource Utilization in the ATLAS Data Acquisition System. Contents. Introduction of the ATLAS DataFlow system Modeling DataFlow and Resource Utilization Cost monitoring explained Example of performance data analysis

E N D
Sander Klous on behalf of the ATLAS Collaboration Real-Time May 2010 Resource Utilization in the ATLAS Data Acquisition System
Contents • Introduction of the ATLAS DataFlow system • Modeling DataFlow and Resource Utilization • Cost monitoring explained • Example of performance data analysis • Conclusions
DataFlow (1) Acronyms: Frontend Electronics (FE) Read Out Driver (ROD) Region of Interest (RoI) Read Out Buffer (ROB) Read Out System (ROS) Trigger Level 2 (L2) Event Filter (EF) Event Builders Local Event Storage To muon calibration centers
Modeling DataFlow and resource utilization • Historically studies have been done with different levels of detail • Paper model (static model) • Back of the envelope calculations • Average data volumes and data fragmentation info • Dynamic model (computer simulation) • Discrete event model of the DataFlow system • Cross-check with results of the paper model • Additional information on queuing in the system • How do these studies match with reality? • What predictions can be made for the future?
Cost monitoringin the real DAQ system • Introduce a mechanism in the running DAQ system to: • Collect performance info (i.e. resource utilization) on the fly • On event by event basis • Group performance information together • Use this information to validate the model • Trigger rates, Processing times • Access to information fragments
Intermezzo (1):Event structure and transport • Data driven • Event contains multiple parts • Header • Meta data • Payload • Meta data added by • L2 (L2 result) • EF (EF result)
Intermezzo (2): Partial event building (PEB) and stripping • Reduced event payload • Calibration events • Not all detector data needed • Smaller events • Partially built at LVL2 • Stripped before stored • By EF or SFO • Improved efficiency • Disk (less storage capacity) • Network (reduced bandwidth) • CPU (bypass L2/EF if possible)
Collect and ship performance data • Performance data stored in L2/EF result: • Each event: • L1 accept time and HLT host local time • HLT application ID • L1 and HLT trigger counters • L1 and HLT trigger decision bits. • Every 10th event: • Start/stop times of HLT algorithms • HLT trigger requesting the HLT algorithm • RoI information, ROB IDs, ROB request time and ROB size
PEB and performance data • Transport information by piggybacking on rejected events that can be built partially: • Without event payload (only L2/EF result) • Avoid mixing with other data • Collection rate of buffered information • Each Nth rejected event (N=100) • Cost algorithm fires, buffer is serialized • Typically less than 1 MB/second collected
DataFlow (2) Buffer performance data Event Builders Buffer performance data Local Event Storage To muon calibration centers
Results • Separate stream with performance data • Automatic NTuple production and analysis • Results listed on html pages: • Trigger rates • Trigger sequences • Processing times • Feedback information for: • Operations and menu coordination • Performance studies, modeling and extrapolation
Example performance study (step 1) • The online L2 monitoring show a long tail in the event processing time (wall clock time): • Trigger Steering @ L2 • Run 142165 • L1 BPTX seeding at 5 kHz
Example performance study (step 2) • In our new tool, we identify the dominating algorithm, responsible for the long tail: Minimum Bias algorithm @ L2
Example performance study (step 3) • With our tool we can investigate the different aspects of the algorithm: Typical retrieval time about 1 ms Problem is in ROB retrieval (congestion?, ROS problem?) CPU consumption is healthy
Conclusions • Cost monitoring is a valuable new tool for performance measurements • The tool makes intelligent use of existing features in the ATLAS TDAQ system • The tool is operational and is working fine, as demonstrated with the example • Next steps: • Validate MC event performance model with real data • Modeling with higher luminosity MC events (extrapolate) • Make cost monitoring available online