Line Plots
200 likes | 323 Views
In this lesson at Meadow Lane Elementary, students will learn how to create and interpret line plots using animal data. We’ll focus on large invertebrates, specifically five giant species, exploring their lengths in centimeters. Students will work in teams, discussing concepts and ensuring everyone understands the material while making the learning process enjoyable. By comparing tables to line plots, students will examine the advantages of each method for visualizing data. Get ready to engage with data, collaborate, and practice your plotting skills!

Line Plots
E N D
Presentation Transcript
Line Plots Susan Phillips Meadow Lane Elementary Lee’s Summit, MO Adapted from Math Thematics, Book 1
In this lesson you will... Learn how to draw and interpret a line plot.
Materials you will need... Pencil Paper
Work as a Team... • Discuss each slide. • Do not go on until you are sure everyone on the team understands the concept presented on the slide. • Take your time. • Have fun!
In this lesson, we will work with animal data. The first type of animals we will use are invertebrates. Invertebrates are animals without backbones. They are often very small. However, we will be investigating very LARGE invertebrates.
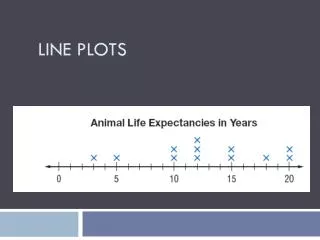
Five Giant Invertebrates X X X X X 25 26 27 28 29 30 31 32 33 34 35 36 37 38 39 Length (cm) show the lengths of five giant invertebrates. This table and line plot
Five Giant Invertebrates X X X X X 25 26 27 28 29 30 31 32 33 34 35 36 37 38 39 Length (cm) Suppose you pick up a bird-eating spider.Will it fiton the tip of your finger,in the palm of your hand, or in both hands?
Five Giant Invertebrates X X X X X 25 26 27 28 29 30 31 32 33 34 35 36 37 38 39 Length (cm) How do you think the data in the table was used to draw the line plot? What information is lost when you transfer data from a table to a line plot?
Five Giant Invertebrates X X X X X 25 26 27 28 29 30 31 32 33 34 35 36 37 38 39 Length (cm) What is the longest length of the giant invertebrates shown? The shortest length? What is the range of the data?
Five Giant Invertebrates X X X X X 25 26 27 28 29 30 31 32 33 34 35 36 37 38 39 Length (cm) Which is easier to use, the table or the line plot, to find the longest and the shortest lengths? Why?
Five Giant Invertebrates X X X X X 25 26 27 28 29 30 31 32 33 34 35 36 37 38 39 Length (cm) What numbers start and end the line plot? Why do you think these numbers were chosen?
Line Plots • A line plot displays data using a line marked with a scale. • The scale must include the greatest and least value of the data. • If you make a line plot before having all your data, you may want to include some extra numbers to the left and right in case the data includes some surprisingly small or large data.
Now you try it! • Use the table on the next slide to construct a line plot.
Use the table and your line plot to help you estimate how many hours a day each of the following animals sleep. (Hint: Look at the clusters of animals in your line plot. Think about what each animal eats and where it sleeps.)
On a new sheet of paper... • List 3 things you liked or disliked about math today. • List 2 ways line plots are different than bar graphs. • List 1 thing you learned today that you did not expect to learn in math class.
Zippidy Do Dah!!!! You are ready to practice making line plots. Please begin the assignment on the assignment board!