Download
1 / 1
10 likes | 71 Views
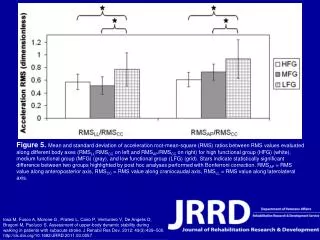
This study evaluates acceleration RMS ratios along different body axes in stroke patients with high, medium, and low functional abilities. Significant differences between groups are highlighted. Published in JRRD, 2012.

E N D
Figure 5. Mean and standard deviation of acceleration root-mean-square (RMS) ratios between RMS values evaluated along different body axes (RMSLL/RMSCC on left and RMSAP/RMSCC on right) for high functional group (HFG) (white), medium functional group (MFG) (gray), and low functional group (LFG) (grid). Stars indicate statistically significant difference between two groups highlighted by post hoc analyses performed with Bonferroni correction. RMSAP = RMS value along anteroposterior axis, RMSCC = RMS value along craniocaudal axis, RMSLL = RMS value along laterolateral axis. Iosa M, Fusco A, Morone G , Pratesi L, Coiro P, Venturiero V, De Angelis D, Bragoni M, Paolucci S. Assessment of upper-body dynamic stability during walking in patients with subacute stroke. J Rehabil Res Dev. 2012; 49(3):439–500.http://dx.doi.org/10.1682/JRRD.2011.03.0057