Download
1 / 24
240 likes | 345 Views
Explore the past 60 million years of climate change, focusing on CO2 levels, paleotemperature, and sea level variations. Dive into the Pliocene warm period, Eemian Interglacial period, and insights from the Devils Hole records. Gain a deeper understanding of past climates and their implications for the future.

E N D
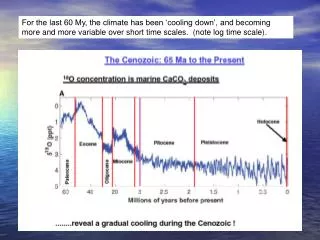
For the last 60 My, the climate has been ‘cooling down’, and becoming more and more variable over short time scales. (note log time scale).
During the last 60 My, the atmospheric inventory of CO2 has also been decreasing • Estimates of Cenozoic atmospheric pCO2 based on two independent proxies in deep-sea sediment cores from the Pacific. • The first curve is estimated from surface ocean pH derived from the boron isotope ratios of planktonic forams. • The second pCO2 curve is based on the d13C values of phytoplankton alkenones . • Both proxies provide nearly identical estimates of paleo-pCO2.
As we move into ‘modern’ times, the record seems to indicate • Less CO2 in the atmosphere, and • More ice volume, • and colder. • It was Cold during the Oligocene (1st Antarctic ice sheet formed) and Hot during the mid-Miocene. • But these are superimposed on a generally decreasing CO2 atmosphere inventory.
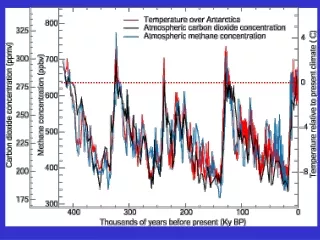
NOTE that the ice sheet volume between glacial and interglacial is only about a factor of 2! The Pliocene warm period from 5 to 3 Ma ago was warmer than today. High-latitude sea surface temperatures were up to 7°C higher, no Greenland ice cap, and the sea level was about 10 to 20 m higher than today. Hence, it represents a possible future climate scenario predicted by numerical models. The last 3 million years show alternating glacial and interglacial climate stages, while glacial ice sheets reached their largest size during the last 700,000 years.
During the Pliocene, global temperatures, particularly at high latitudes, are believed to have been significantly warmer than today. Above figure shows the Pliocene surface air temperature increase compared to the present day simulated by the NASA/GISS global climate model. Values are in °C. This is how global warming was distributed in the Pliocene
Pliocene sea surface temperatures. Differences from modern values values for two selected months. Units are °C.
The Pliocene was the time when our ancestors developed (5 to 1.8 My) • And was the beginning of the ‘modern’ glacial/interglacial cycles. • Relative to today, the Pliocene warm period was characterized by • 3.5 °C higher global surface temperatures, • 10-20 m higher sea level, • enhanced thermohaline circulation, • slightly smaller Antarctic ice sheets, • small Northern Hemisphere ice coverage, and • 30% higher atmospheric CO2 concentrations
The Answer to what caused the Pliocene Warm Period? Probably a combination of increased CO2 plus enhanced thermohaline circulation. But that causes serious problem with Climate Modelers The warmer polar regions should REDUCE meridional heat transport (the heat pump from the equator to the poles), not INCREASE it. And INCREASED CO2 levels in the atmosphere should cause the equatorial temperatures to also INCREASE But they don’t. The ‘jury is still out’ on this question. i.e., we really don’t know what is going on in the Pliocene…
Eemain Interglacial period perhaps the BEST analog of future climate change. • Temperature peak for the Eemian occurred about 125,000 years BP, • Global temperatures were about 3.5 deg C warmer than present. • In Europe, where data is really good, pollen from drill cores indicates that temperature forests moved into areas that are now arctic tundra. • Which translates to about 7 to 8 deg C higher in the Arctic latitudes. • Note that current model estimates are that arctic temperatures only have to be 5 to 8 deg C higher – to melt the Greenland ice cap… • Eemian sea level estimated to be 3 to 5 m higher than present…
Note that 3 deg C over pre-industrial Holocene climate is in the middle of the range for what climate models anticipate the temperature would be by 2100. We've had about 0.76 deg C of warming from pre-industrial temperatures so far. So, in the Eemian period when temperatures were warmer, and similar to future predicted temperatures, how HIGH was the sea level back then? At least three meters, and probably more than five meters higher than today. Evidence for this is strong; i.e., the Baltic Sea was significantly larger than present.
What is Devils Hole?Devils Hole is a tectonic cave developed in the discharge zone of a regional aquifer in south-central Nevada. The walls of this cave are coated with dense vein calcite. The stable isotopic content of the calcite provides a 500,000-year record of variations in temperature and other paleoclimatic parameters. The Devils Hole d18O record is an indicator of paleotemperature and corresponds in timing and magnitude to paleo-SST (sea surface temperature) recorded in Pacific Ocean sediments off the California and Oregon coasts. The record is also highly correlated with major variations in temperature in the Vostok ice core, from the East Antarctic plateau.
Records of sea level change during the Eemian Last Interglacial period are about 5 meters – associated with a 3.5 deg temperature increase. There is considerable debate in the paleo-climate community about WHERE THIS WATER IS COMING FROM. Recent studies indicate that much (most) of this came from the melting of the Greenland ice sheet.
Using the relationship between d18O and temperature (a) below (0.4 per mil/deg C for Greenland), and the relationships between ice melt + snow fall in Greenland and temperature - which are based in part on the thickness of the ice core over that time period, it is possible to predict sea level change due the warming of the temperature in Greenland.
Three different models of the Greenland ice sheet volume at Eemian maximum temperature, using 3 different climate sensitivity values (a). Model C is the most likely, but the range is between 4.1 and 5.4 meters of sea level change.
Estimated Sea Level Rise from Total Loss of Ice Sheets - (with no sea water temperature change) Greenland Ice Sheet = 7 meters West Antarctic Ice Sheet = 5 meters E + W Antarctic Ice Sheet = 70 meters Sea Level Rise projection for 2000 to 2100 = 0.1 to 0.88 meters
But – don’t become too complacent with the old (i.e., 2006) models: New data indicates that the ice discharge from many major Greenland ice streams has accelerated markedly.
Sea Level Rise of 3 meters in NE U.S. – red areas are underwater.
Sea Level Rise of 3 meters in Florida – red areas are submerged.