Download
1 / 19
190 likes | 209 Views
Study linking bottom water hypoxia to fish distribution. Data analysis, spatial regression, and GAMs used to analyze biomass variation and vertical distribution. Findings show fish abundance influenced by hypoxic zone boundaries and vertical avoidance behavior.

E N D
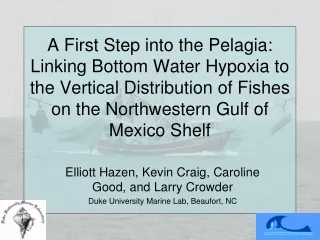
A First Step into the Pelagia: Linking Bottom Water Hypoxia to the Vertical Distribution of Fishes on the Northwestern Gulf of Mexico Shelf Elliott Hazen, Kevin Craig, Caroline Good, and Larry Crowder Duke University Marine Lab, Beaufort, NC
Introduction • Tommy Munro (July 19-Aug 1, 2004) • Two sitesin GoM • 41 stationsubset Day: 1200-1800 Night: 00-600
Hypotheses • There is less total biomass within the hypoxic zone compared to normoxic bottom waters. • Horizontal distribution of biomass will be greater at hypoxic edges declining with distance. • Vertical distribution of fish differs between areas with normoxic and hypoxic bottom waters
Methods • CTDs measured: • Temperature • Salinity • Dissolved oxygen • Paired trawls • Flat and Mongoose • Downward looking 120 kHz SIMRAD EK60 echosounder • Volume backscatter (Sv) in decibels (dB)
Data Analysis • Sonar 5 Pro for acoustic data, -90 dB threshold, 1 meter bins • Spatial Statistics • Thin plate spline interpolations for DO • Spatial regression on all stations (Mantel 1967) • Generalized Additive Models (GAMs) for non-linear and linear components • Run separately for stations with hypoxic (< 2.0 mgO2·L-1) and normoxic bottom waters
Results Site B Site A Hypoxic mean = -60.1 dB Normoxic mean = -58.2 dB Site A mean = -62.7 dB Site B mean = -66.5 dB
Acoustic Station Trawls Anchovies Other Fish 4% 8% 38% 53% Croaker Bumper
Mantel’s Test O2 0.012 Depth (m) 0.040 0.176 0.150 0.042 Temp. 0.035 Salin. Space Backscatter 0.087 0.038 Time of Day 0.050 Hyp.Thick 0.021 0.11 Bathym. 0.12 Dist.Edge
Normoxic / Hypoxic Station 55 Station 38
Stations • G62 – Hypoxic, Night, DO= 1.0 mgO2·L-1 • 11,618 croaker, 88 other fish 17m 1m
Stations • G106 – Normoxic, Night, DO= 4.5 mgO2·L-1 • 1415 bumper, 14 other fish 7m 1m
Relative Biomass Even distribution
GAMs Normoxic Hypoxic
GAMs Normoxic Hypoxic
GAMs Normoxic Hypoxic
GAMs Normoxic Hypoxic
Conclusions • Evidence of fish biomass within the boundaries of the hypoxic zone • The relationship with the horizontal edge was complex and not linearly significant • Vertical compaction above hypoxic bottom waters • Vertical avoidance • Altered diel migration • Potential food web interactions
Acknowledgements • NOAA Center for Sponsored Coastal Ocean Research