Download
1 / 23
230 likes | 330 Views
Explore the decomposition of net trade in value added and its components, focusing on factors influencing trade patterns. This study covers data from WIOD project, including factor content of trade, global trade patterns, and implications for various sectors.

E N D
Decomposing net trade in value added and the patterns of trade in factors Robert Stehrer The Vienna Institute for International Economic Studies (wiiw) Robert.Stehrer@wiiw.ac.at WTO workshop, February 2-4, 2011 – WTO, Geneva Version: 2011-02-01 The WIOD-projectisfundedbythe European Commission, Research Directorate General aspartofthe 7th Framework Programme, Theme 8: Socio-EconomicSciencesandHumanities, Grant Agreement no: 225 281.
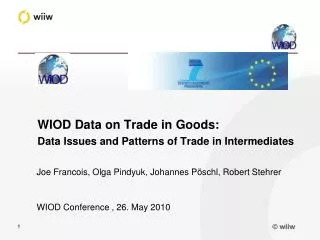
WIOD project – www.wiod.org • The World Input-Output Database (WIOD) • Project funded within the 7th framework program of the EU • 10+OECD partners involved • Project started in May 2009 and ends in April 2012 • Construction and applications • Construction of inter-country SUT/IO tables • Socio-economic and environmental satellite accounts • Data publicly available in May 2012 • Various applications ...
WIOD project – Data coverage • Inter-country Supply-Use and Input-Output tables • Benchmarked to NA data • Period: 1995-2006 (maybe with extension) • 40 countries included • EU-15 countries • EU-12 countries • NAFTA: Canada, USA, Mexico • BRI: Brazil, Russia, India • CHN: China • OTHER: Turkey, Japan, South Korea, Taiwan, Indonesia, Australia • Sector and product classifications of SUTs • 59 products (corresponding to CPA) • 35 industries (corresponding to NACE rev. 1)
WIOD project – Data coverage • Trade data • Goods trade (HS 6-digit – use category – CPA) • Services trade (BoP codes) • Satellite accounts • Energy and environment (emmission, etc.) • Socio-economic indicators • Capital (ICT and Non-ICT) • Labour by three educational attainment categories • Deflated tables
Value added trade and the factor content of trade • Related literature • Vertical specialisation • Hummels, Ishii and Yi (2001), etc. • Daudin, Rifflart and Schweisguth (2008, 2009) • Johnson and Noguera (2009) • Koopman, Power, Wang and Wei (2010) • Many others • Focus on exports • Factor content of trade (when intermediates are traded) • Reimer (2006) • Trefler and Zhu (2010) • Focus on HOV and relationship of trade in factors to endowments • This approach: • Foster and Stehrer (2011), forthcoming • Focus: Decomposition of net trade in value added and components
Value added trade and the factor content of trade Accounting for trade in intermediates (following Reimer, JIE 2006; Trefler and Zhu, JIE 2010) N … Number of countries; G … Number of industries; F … Number of factors Direct plus indirect factor input A … coefficient matrix of dimension NG x NG D … direct factor input matrix of dimension F x NG ‘Bilateral’ (NG x N) import-export matrix
Value added trade and the factor content of trade • Factor content of trade with three countries for country c=1 • where • Somemanipulations …
Value added trade and the factor content of trade Direct exports Re-Imports (VS1 ) Indirect imports Indirect exports (‘true’ VS1 ) Direct imports
Selected results • Decomposition of net value added trade and components • Regional patterns of net value added trade and components • Notes: • Focus of presentation on EU-15 and NAFTA • January 2011 version of WIOD • ROW not included in calculations • Results partly based on imputed values regarding factor inputs
Decomposition of value added trade EU-15 NAFTA in bn US-$ in bn US-$
Decomposition of trade in labour EU-15 NAFTA in bn US-$ in bn US-$
Decomposition of trade in high-educated labour EU-15 NAFTA in bn US-$ in bn US-$
Net exports of EU-15 Goods and services Value added in bn US-$ in bn US-$
Net exports of NAFTA Goods and services Value added in bn US-$ in bn US-$
Net exports in labour and capital services – EU15 Labour Capital in bn US-$ in bn US-$
Net exports in labour and capital services – NAFTA Labour Capital in bn US-$ in bn US-$
Net exports by educational categories EU-15 NAFTA in bn US-$ in bn US-$
Trade in value added: ICT capital in bn US-$
Next steps: Analysis the obvious candidates which are mutually related (Directed) Factor and sector biased technical change Change in trade and output patterns Change in intermediates trade Change in factor rewards • Decomposition based on basic equation • Further steps, extensions, caveats: • Breakdown of trade data into final goods and intermediates (and subcomponents like P&C) • Sectoral breakdowns and differentiations • Bilateral relations • Testing HOV theorem with traded intermediates • Double counting problem • Non-competing imports
Next steps: Data Improvement on data Improving national SUTs Improving bilateral trade in services and trade in goods Re-exports Improving breakdown by use categories (see below) Comparing our use-classification of trade flows with official import IO tables. Improving factor input data for non-OECD countries as part of work by World KLEMS consortium Constant price series Additional data Processing export trade tables for Mexico and China Margin tables (transport costs, tariffs, and domestic margins of exports)
Thank you for attention! Robert Stehrer The Vienna Institute for International Economic Studies – wiiw www.wiiw.ac.at Robert.Stehrer@wiiw.ac.at The WIOD project: www.wiod.org