Download
1 / 51
510 likes | 702 Views
Werribee A story of wastewater and vegetable production in Melbourne. Werribee & Wastewater Treatment. WTP. Werribee ~30 km from CBD Melbourne’s first WWTP – late 1800s covers 10,851 ha largest sewage treatment plant in the world (by area)

E N D
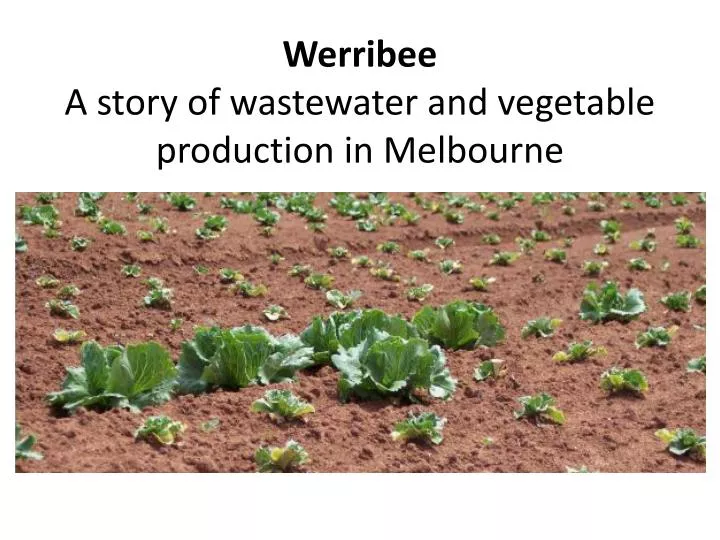
WerribeeA story of wastewater and vegetable production in Melbourne
Werribee & Wastewater Treatment WTP • Werribee ~30 km from CBD • Melbourne’s first WWTP – late 1800s • covers 10,851 ha • largest sewage treatment plant in the world (by area) • treats ~54% of Melbourne’s sewage and most industrial wastewater
Western Treatment Plant (WTP) • Treatment: • series of waste stabilisation ponds • activated sludge treatment
Western Treatment Plant (WTP) HOR UV Cl2 • “End Uses”: • discharge to Port Phillip Bay • on-farm irrigation at WTP • further treatment (UV and chlorination) and delivery to WID for irrigation of market gardens “Class C” Water
Werribee Irrigation District (WID) • irrigation district since early 1900s • diversion weir on Werribee River and main channel completed in 1912; system of channels constructed to supply water for stock and domestic and irrigation • 2384 ha of irrigated market gardens • commercial vegetable production (mainly broccoli, lettuce, cauliflower and cabbage) • annual agricultural output: ~$70 million • proximity to markets (local, national and international) • traditionally relied on Werribee River water and groundwater • use of recycled water from WTP started in 2005 • green wedge location
Water Delivery • open channels – many can be seen and accessed through most of the district from road sides • river and recycled water • up to 61 ML day−1 recycled to >170 customers • water piped from WTP to water distribution network http://www.melbournewater.com.au/images/recycling/werribee_big.jpg
Timeline of events • Historically – access to Werribee River water and groundwater for irrigation • Autumn 2003 – worsening of drought • 1 July 2003 – 5% river allocation (unprecedented) • 10 Nov 2003 – due to increased groundwater demand - ban on groundwater pumping to protect aquifer • 8 Jan 2004 – approval to go ahead with recycled water • Late Jan 2004 – potable water supplement into supply • Jan 2005 – first delivery of recycled water to growers (shandied with river water to lower EC) • 2006 and 2008 – major crop losses linked to use of recycled water
Werribee Irrigation Allocations (%) Werribee River Groundwater Rodda, 2008 and Our Water, Our Future http://www.ourwater.vic.gov.au/monitoring/monthly/irrigation_allocations__and__diversions • Groundwater bans • to avoid saltwater intrusion into aquifers • full ban since 2006 • Limited river water and groundwater = majority of growers (~95%) using recycled water.
Salt in Wastewater • concentration in influent is relatively high • 44% of salt from industrial wastewater, ~25% from homes • salt widely used in manufacturing processes (cleaning in food industry, neutralisation of industrial effluent in manufacturing, by-product of operations such as tanneries) and found in detergents and soap products • WTP irrigation scheme – originally designed to include “shandying” or mixing of recycled with river (interim to 09) • plan: implementation of salinity reduction measures and return of river water to environmental flows • plan failed due to lack of rainfall and increasingly severe domestic water restrictions • result: less dilution of wastewater to WTP and higher salt concentrations (recycled and river)
Salinity Levels Shandying 2006 incident 2008 incident Werribee Weir (231204) http://www.vicwaterdata.net/vicwaterdata/data_warehouse_content.aspx?option=3
Environmental Impacts and Risks • Salinity - impacts on plant growth and soil • Osmotic effect – salt in soil competes with roots for water • Toxicity – salt species and concentration may not be present in a desirable ratio (may inhibit uptake of nutrients or plant metabolic functions) • Reduced soil infiltration – caused by build-up of sodium that degrades soil structure and inhibits penetration of water • Unknown contaminants • may be present in sewage • Potential for sabotage (intentional/unintentional) with channel system • occurred in past • Others?
Crop damage in Werribee – 2006 • investigation commenced 30 October – initiated by SRW • crops affected: predominantly lettuce • 12 growers affected, all using >80% recycled water (BUT, not all recycled water users were affected) • ~50 acres affected • low river and groundwater allocations at the time • daily max temperatures between 15 and 30°C Affected iceberg lettuce crop in the WID (3 Nov 06)
The Investigation - observations • planted on 12 Sept 2006 - normal size and healthy • planted between 17 Sept and 4 Oct 2006 - stunted, patchy growth • What did we do? • Spoke to farmers, irrigators and water authority (SRW) • Visited affected farms and recorded observations Lettuce left of sprinkler line planted 12 Sept. Lettuce to right of sprinkler line planted 17 Sept, displaying stunted, patchy growth (photo taken 02 Nov).
Planted 17 Sept 2006 (Photo 2 Nov 2006) Planted 20 Sept 2006 (Photo 3 Nov 2006) • 4 properties investigated • lettuce ~1-1 ½ months old and still close to transplantation size • less stunted plants (10-12 cm diameter) interspersed within the beds of severely stunted plants (<7 cm) • less stunted plants often on one side of the sprinkler lines • ‘sprinkler effect’ often observed to be strongest in the two beds closest to and west or north of the sprinkler lines • a lack of recorded data on the timing of irrigation over the affected crop period, means that a ‘wind effect’ cannot be corroborated by weather data Planted 21 Sept 2006 (Photo 3 Nov 2006) Planted 27 Sept 2006 (Photo 30 Oct 2006)
Some plants remained near to transplantation size after more than a month. severe stunting Lettuce planted 21-09-06, displaying severe stunting at 5 weeks after transplanting (photo taken 30-10-06). deformed roots
recycled water salinity 1650 to 1800 μS/cm, but water quality within targets and did not vary significantly • residual chlorine below threshold • no unexplained variation in water treatment process over incident period that could be linked to such an impact • chemical spray records sourced - did not identify any likely cause of contamination • no evidence of illegal discharges into channel system • no physical evidence of any herbicide entering into the irrigation system
The Investigation - sampling • soil and plant samples collected from affected properties • samples of recycled water used to irrigate the crops during the period of concern were not available for testing • soil samples were tested for fertility and salinity-related parameters: pH, salinity, nutrients • plant samples were tested for : • macro- and micro-nutrients: N, P, K, S, Ca, Mg, Cu, Zn, Mn, Fe, B • salinity-related parameters: Na and Cl • heavy metals: As, Cd, Cr, Pb, Ni • herbicide, fungicide and insecticide residues
Samples Results Investigation commenced ~ 6 weeks after event – so effectiveness of investigation was severely hampered nutrient analyses - did not explain the stunted growth high soil salinity was not confined to areas with severely stunted plants but also supported less stunted plants (soil salinity primarily due to residual fertiliser and gypsum and not to common salt (NaCl)) heavy metal concentrations all below levels toxic to plant growth no herbicide residues detected (plant analysis) above the maximum residue limits for a wide range of commonly used herbicides (although some herbicides are active below detection limits) fungicide and insecticide analysis determined that concentrations were within maximum residue limits plant pathogens ruled out climatic conditions were NOT extreme
Conclusions - 2006: causative agent(s) for the observed stunting in lettuce crops not been determined did not preclude the possibility of chemical (or other) contamination as a potential cause of lettuce stunting investigation did not preclude the possibility of contamination of the recycled water applied the investigation was severely limited by the non-availability of soil, water, and plant samples from the incident period.
Crop damage in Werribee – 2008 • crop damage in early January 2008 (hot temperatures) • crop affected: predominantly lettuce • ~ 10 growers affected • investigation by Dr Peter Taylor (plant pathologist) • MW commissioned experimental work by FBR • Symptoms: • chlorosis or yellowing of leaves • stunting or lack of growth • severely affected plants were wilted with older leaves that had died and shrivelled • roots: brown, stubby laterals • distribution of affected plants was patchy
The Evidence…. what happened in Werribee • Env. Conditions • high temperature • low humidity • Irrigation Situation • high salinity river water (3500 μS/cm) • chloramination mode (1 - 6 Jan 2008)
Water Treatment & Chloramine • Chlorine (Cl2) is often used for disinfection of wastewater • chlorination is a complex process affected by wide range of env parameters such as pH, temp, and quality of water being treated • chlorination is popular because of rel. low cost and long history of effectiveness • portion of chlorine added is consumed/reduced by reaction with inorganic and organic materials = chlorine demand. Chlorine left over is residual chlorine • Chloramine (NH2Cl) is an alternative to chlorine for the disinfection of water, particularly drinking water • Chloramine is formed by the reaction of ammonia (NH3) and Cl2 in water, and is more persistent than chlorine in water particularly at higher pH levels • The stability of chloramine provides a longer disinfection time, which is advantageous for drinking water distributed through long distribution channels • In wastewater treatment, NH3 is often present in high concentrations and the formation of monochloramine may occur unintentionally if NH3 levels exceed their treatment capacity
Free ammonia reacts with chlorine to form monochloramine until ammonia has been consumed Continue to add chlorine to the water. After complete formation of monochloramine, monochloramine reacts with additional chlorine to form dichloramine and nitrogen trichloride; addition of Cl2 continues to oxidize these compounds to N gases. Continue to add chlorine to the water. After chlorine demand is exhausted, chlorine reacts with ammonia to form monochloramine (NH2Cl) After the breakpoint, all chlorine added to the water remains as free chlorine (breakpoint chlorination). Monochloramine is equivalent to total chlorine until Section II where it reacts with chlorine to form new compounds. No monochloramine remains at the breakpoint. Breakpoint Chlorination Cl2+ H2O →HOCl + OCl- HOCl + NH2Cl→NHCl2+ H2O Begin adding chlorine to a solution containing ammonia. Initial addition of chlorine reacts to exhaust any chlorine demand present in the water Cl2 + H2O HOCl + OCl HOCl + NH3→NH2Cl + H2O Free chlorine does not exist until after the breakpoint Breakpoint: point at which all dichloramine is converted to N gas http://www.hach.com/fmmimghach?/CODE:HACHCHLORAMINATIONOV6075|1//true
Chloramine formation affected by: pH (8.3 is optimal) chlorine to ammonia-N ratio temperature (lower reduces rate of reaction) mixing efficiency reaction time VERY complicated reaction!
Previous Monochloramine Events were very different
Chlorine (Cl2) and Plants • some understanding of the toxicity of Cl2 to terrestrial plants, but very limited research that has specifically evaluated chloramine • Datnoff et al. (1987) found that Cl2 was phytotoxic to cabbages at 200 mg Cl /L (total Cl2) • Carillo et al. (1996) found that, using chlorine dioxide, a concentration of 26 (mg/L) free Cl2 was toxic to both radish and lettuce seedlings • In experiments where soilless media was used, growth of capsicum and tomato declined at 8 mg/L free Cl2, while lettuce declined at 18 mg/L(Frink and Bugbee, 1987). This experiment also found that germination of vegetable seeds was not affected by Cl2 treatments
Chloramine (NH2Cl) and Plants • research restricted to hydroponics in Japan (Date et al.) and a significant report published by the Urban Water Research Association of Australia (UWRAA) in 1990 Date et al. determined the following: • NaOCl (forming chloramine in hydroponic sol’n) decreased lettuce growth rates, caused root browning and wilting • root browning caused by solutions containing both HOCl and ammonium ions • solutions with ~chloramine concentration 0.21 mg Cl /L - seedlings exhibited intensive root browning, slight wilting of outer leaves and significant reduction in growth rate • ~ chloramine conc 0.28 mg Cl /L - most mature leaves wilted completely
UWRAA research demonstrated the following: • dry weight of wheat and peas not affected by foliar applications of monochloramine up to 71 mg /L • soil applications had limited effect on plant dry weight and for plants grown in fine sandy clay loam, only the highest chloramine conc’n (225 mg Cl2/L) decreased dry weight; plants grown in a sandy soil affected at lower conc’n • dry weight of both peas and wheat declined at 22 mg Cl2/L although iron deficiency in peas may have contributed to the lower plant dry weights at lower concentrations • dry weights decreased as chloramine concentration increased above 22 mg Cl2/L • Note: report did not provide statistical analysis for experiment therefore it is impossible to determine if differences in plant dry weights are significant at the threshold values reported
Guideline Values for Monochloramine • Drinking water: • 3 mg/L (WHO and NHMRC) • Irrigation: • no limits for monochloramine; • < 1 mg/L of chlorine at the point of application (EPAV, US EPA) • Target for irrigation: • 3-5 mg/L for Class A reclaimed water (Melbourne Water), resulting in ~1 mg/L at point of use
Initial investigation (Dr Peter Taylor): • Ruled out: • nutrient deficiencies • plant pathogens • salinity (alone) • Suggested theory of cause: • combination of factors: • high temp - increased transpiration rates • root damage – monochloramine • uptake of saline water • Recommendation • research to determine critical level of monochloramine in recycled water that is damaging to lettuce growing in soil
Project Commissioned by MW • Objectives: • To evaluate the impact of monochloramine on the growth of iceberg lettuce: • under extreme climate conditions • combined with salinity • in Werribee soil
Decay (water) Decay (growth media) PRELIMINARY TRIALS Dose-Response Monochloramine + Salinity Extended Irrigation and High Temp MAJOR TRIALS
Crop Management • Growth room • controlled light and temperature – logged • humidity control - unsuccessful • 16-hour photoperiod • Lettuce • seedlings from BoomarooNursuries, Lara • planted into individual pots (20 cm diameter; ~6 kg dry media) • Fertiliser • controlled release complete fertiliser with trace elements (Osmocote Plus for Pots) • Irrigation • initial “wetting up” with dechlorinatedtap water • manual overhead irrigation • saucers under pots to enable soil saturation • irrigation rates informed by standard district practice and evapotranspiration rates at the time of the 2008 incident (FAO56 between 4.7 and 8.8 mm/day)
Harvest Measurements • Lettuce Heads • cut at base and weighed (fresh weight) • placed into paper bag and oven dried (70°C ) for 48 hours – weighed (dry wt) • Lettuce Roots • intact roots: roots gently teased from the growth medium, washed with tap water and weighed • root pieces: roots remaining in the growth medium were manually removed, washed and weighed • fresh roots placed into paper bag, oven dried (70°C ) for 48 hours and weighed (dry wt)
Preparation & Analysis of Water • Water • Class C recycled water • no pH adjustment as water usually >pH 7 • salinity, pH and temperature recorded using a hand-held meter • Monochloramine Treatment • added ammonia and sodium hypochlorite to recycled water • measured using a HACH spectrophotometer (DR 2800) using 2 methods: • total and free chlorine (assumed that difference is monochloramine) • Indophenol method - monochloramine-specific, avoids organic monochloramines • Salinity Treatment • NaCl added to recycled water to attain the specified concentration • Dose-Response Experiment • individual recycled water samples dosed with ammonia and sodium hypochlorite • irrigation by treatment (not by block) • Monochloramine + Salinity • stock monochloramine mixture prepared from neat recycled water • recycled water samples spiked to the appropriate monochloramine concentration • irrigation by block
4 growth media tested • Werribee soil • coarse sand • standard potting mix (a mixture of fine sand and composted pine bark) • 50:50 mix (soil:sand) • Method • 10 ml of growth medium into 50 ml falcon tube • filled to 15 ml with monochloramine solution • shake ten times then centrifuged at 14000 rpm for 30 minutes at 25°C • supernatant was then removed to another falcon tube and centrifuged for 30 minutes • test resulting supernatant • Solution • monochloramine solutions up to 26 mg/L Cl2 • Results Decay in Growth Media – Preliminary Trial
Decay (water) Decay (growth media) PRELIMINARY TRIALS Dose-Response Monochloramine + Salinity Extended Irrigation and High Temp MAJOR TRIALS
106 cm 50 cm • Treatments (16 treatments x 4 reps = 64 plants) • Continuous dosing: 0.5, 1, 2, 3, 5, 9 mg/L Cl2 • Spike: 1, 2, 3, 5, 7, 9, 12, 15 mg/L Cl2; then deionised water • Controls: recycled water (no monochloramine added), deionised water • Statistical Design • lattice design (includes blocking and randomised location of treatments) • Logic for concentration ranges: • SRW guidelines – max of 5 mg/L Cl2 • very low concentrations – reflecting previous research • high concentrations reflect extreme worst case scenario (spike) Dose-Response Experiment • Lettuce • Lactucasativa L. cv. ‘Seagull’ • transplanted on 24 March 2009 • harvested 8-11 April 2009 (15 - 18 days post transplant)
no stunting observed • all plants grew rapidly • harvested 2 weeks after transplanting • significant differences were detected in fresh weights of intact roots (P=0.043) and all roots (P=0.019), but no clear trend in post-hoc differences between means • no significant differences (P>0.05) for any other harvest measurements Dose-Response Experiment – Results
Decay (water) Decay (growth media) PRELIMINARY TRIALS Dose-Response Monochloramine + Salinity Extended Irrigation and High Temp MAJOR TRIALS
Treatments (4 treatments x 16 replicates = 64 plants) • neat recycled water (~2500 S/cm as received), no monochloramine • neat recycled water (~2500 S/cm as received), 4–5 mg/L monochloramine as Cl2 • recycled water (3500 S/cm), no monochloramine • recycled water (3500 S/cm), 4–5 mg/L monochloramine as Cl2 • Statistical Design • latin square design in a 2x2 factorial arrangement • Lettuce • Lactucasativa L. cv. ‘Marksman’ • transplanted on 22 April 2009 • harvested lettuce heads on 27 May 2009 (35 days after transplanting) • harvested roots 27-29 May 2009 • Irrigation • irrigated one block at a time • week 1 – treatments • week 2+ - neat recycled Monochloramine + Salinity Experiment
temperature and humidity – similar to dose-response experiment Monochloramine + Salinity Exp’t - Results
no stunting observed – no significant harvest measurements (P>0.05) • harvest - plants harvested on one day Monochloramine + Salinity Exp’t - Results
Extended Irrigation and High Temperature • Treatments (day 1 only; neat recycled water afterwards) • saline recycled water (3300 S/cm) dosed with monochloramine (5 mg/L Cl2) • neat recycled water • Statistical design • randomised block design • Lettuce • days 1 and 2 – hot (38 – 43°C daytime maximum) followed by temperate conditions • “hot wind” – used small portable heater fans for short periods • Irrigation • every 5 minutes for 1 hour, immediately after transplanting • 2nd extended irrigation 7 hours later • Results • no significant treatment effects • transplanted 2 May 2009, harvested 26 May 2009 • heater fans were hard to control - burned plants
Overall Conclusions symptoms of chlorosis, stunting and wilting of leaves were not replicated, regardless of the treatments applied lettuce head weight was not affected by monochloramine concentrations up to 15 mg/L Cl2 combined effects of monochloramine and high salinity irrigation water did not significantly affect harvest measurements