Monthly Trends in Local Congestion Costs and Overloaded Elements Analysis
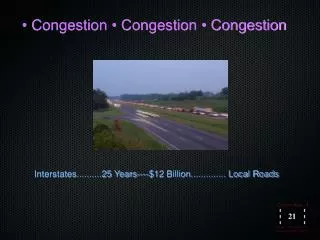
This report, prepared by Isabel Flores, provides a comprehensive analysis of local congestion costs over the past 12 months, detailing figures in millions of dollars. Key insights include the costs associated with Out of Market Capacity (OOMC), Balancing Energy, and Replacement Reserves (RPRS), along with the performance of OOM and Local Balancing Energy (LBE) both up and down. The report also highlights the most congested and overloaded elements, specifically addressing changes in inter-zonal costs for February and March.

Monthly Trends in Local Congestion Costs and Overloaded Elements Analysis
E N D
Presentation Transcript
Congestion Report Isabel Flores
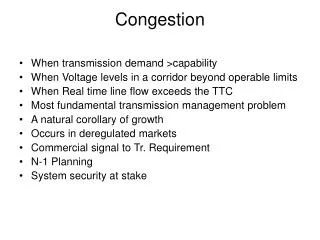
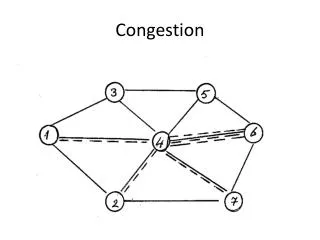
Background • Provide trend of local congestion costs for last 12 months • Costs shown in millions • OOMC • OOM Down • LBE Down • OOM Up • LBE Up • RPRS • Top congested elements • Inter-zonal costs - 2009
Inter-zonal Congestion Costs 2009 Settlement quality dollars.