Download
1 / 19
190 likes | 481 Views
PRODUKTIVITAS EKOSISTEM MATERI & NON-MATERIAL. Regina R.B, Ieke , W.A., dan Soemarno – Des 2012. HASIL AIR. The choices we make today in how we use land and water resources will have enormous consequences on the future sustainability of earth’s ecosystems and the services they provide.

E N D
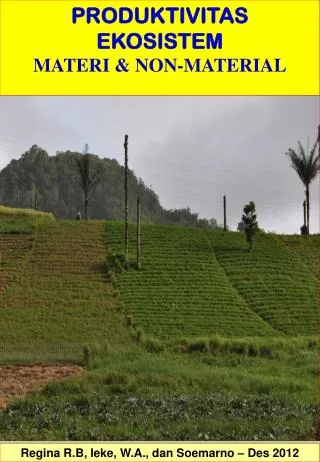
PRODUKTIVITAS EKOSISTEM MATERI & NON-MATERIAL Regina R.B, Ieke, W.A., danSoemarno – Des 2012
The choices we make today in how we use land and water resources will have enormous consequences on the future sustainability of earth’s ecosystems and the services they provide.
Kota yang rawan air tawarakibatmenipisnyajumlah air tanahdangkaldanatauterancamkekeringan , makahutanlindungharusdibangundilokasitangkapansebagaipenyerap, penyimpan, danpemasok air. AgroEkosistemlerenggunungdenganjasaamenitasnya (fotosmnojuli 2009)
HASIL AIR VARIABLES AFFECTING WATER YIELD There is a direct relationship between the amount of water available in a watershed, climate, and climate variability. The fraction of precipitation that will reach stream channels depends on the amount and type of vegetation cover, the physiography, and land use(s) of the watershed. Climate is responsible for precipitation quantity, intensity, and duration, as well as storm distribution within a watershed, the results of which significantly impact streamflow regimes and the annual hydrograph. As an example, when a relatively large storm occurs in the upper part of a sufficiently large watershed, the resulting hydrograph will exhibit a lower peak flow, longer time base, and a slower rise to peak. Higher elevations also undergo potential snow deposition processes (depending on season), which can also affect the hydrograph by lowering and broadening it. In watersheds having sufficiently cold temperatures, usually in higher altitudes, snowfall accumulates forming snowpack, and no significant overland or subsurface runoff is displayed until snowmelt. In the event of an extreme warming event, rapid climate-induced rain, wind, and subsequent snowmelt (rain on snow, ROS) can result in flashfloods with often costly and disastrous consequences for communities located in the floodplain. Diunduhdari: http://www.eoearth.org/article/Variables_affecting_water_yield………….. 22/12/2012
HASIL AIR WHAT IS GROUNDWATER? Rainwater percolates into the earth. Soil and rock are like a giant sponge, full of holes - typically tiny pores and cracks just millimetres in size. Below the water table, these holes are full of water. This is groundwater. Groundwater slowly travels through connected pores and cracks just centimetres to metres per year. Diunduhdari: http://www.nrcan.gc.ca/earth-sciences/products-services/mapping-product/geoscape/waterscape/bowen-island/6041………….. 22/12/2012
HASIL AIR Water table ups and downs through the seasons The amount of water stored underground changes through the seasons. As winter and spring rains infiltrate the ground, stored groundwater increases and the water table rises. When the rains stop, the water table falls as groundwater leaks into streams and the ocean. Well pumping also removes water and lowers the water table. Excessive pumping of groundwater can result in long-term depletion of groundwater storage. Diunduhdari: http://www.nrcan.gc.ca/earth-sciences/products-services/mapping-product/geoscape/waterscape/bowen-island/6041………….. 22/12/2012
HASIL AIR Underground lakes and rivers? Not on Bowen Island. Large underground streams and lakes only occur in limestone cave systems. Limestone is unique as it dissolves in water, allowing caves to form. Bowen Island's granitic and volcanic rocks do not dissolve in water and so lack cave systems. Diunduhdari: http://www.nrcan.gc.ca/earth-sciences/products-services/mapping-product/geoscape/waterscape/bowen-island/6041………….. 22/12/2012
HASIL AIR Tapping into water stored underground Any body of rock or sediment that yields useful amounts of water is an aquifer. Bowen Island has two types of aquifer: fractured rock, and sand and gravel layers. The amount of water stored in fractured rock is typically limited, and these aquifers can run low during the summer drought. Sand and gravel can store more water and these aquifers are less likely to dry up in the summer. Shallow- dug wells can dry up as the water table falls during the summer. Groundwater flows from upland recharge areas to valley discharge areas Diunduhdari: http://www.nrcan.gc.ca/earth-sciences/products-services/mapping-product/geoscape/waterscape/bowen-island/6041………….. 22/12/2012
HASIL AIR Surface water and ground water relations. All groundwater pumping comes from capture; the greater the intensity of pumping, the greater the capture. Capture comes from decreases in natural discharge and increases in recharge. Natural discharge supports riparian, wetland, and other groundwater-dependent ecosystems, as well as the baseflow of streams and rivers. Capture depends on usage, and it is not related to size or hydrogeological characteristics of the aquifer, or to the natural recharge. Sustainable yield depends on the amount of capture, and whether this amount can be accepted as a reasonable compromise between a policy of little or no use, on one extreme, and the sequestration of all natural discharge, on the other extreme. Diunduhdari: http://ponce.sdsu.edu/groundwater_sustainable_yield.html………….. 22/12/2012
HASIL AIR . Recharge and discharge in groundwater systems: (a) pristine, (b) developed, (c) depleted. In the pristine groundwater system (Fig. 4 a), [average] natural recharge is equal to [average] natural discharge, net recharge is zero, and pumping is zero. Thus, natural recharge (the blue block on the left) equals natural discharge (the blue block on the right) (Fig. 4 a). In the developed groundwater system (Fig. 4 b), captured recharge (the brown block on the left) is the increase in recharge induced by pumping. Likewise, captured discharge (the brown block on the right) is the decrease in discharge induced by pumping. Then, residual discharge (the blue block on the right) is equal to natural recharge (the blue block on the left) minus captured discharge. Net recharge is equal to the sum of captured recharge plus captured discharge. Net recharge varies with the intensity of pumping; the greater the intensity of pumping, the greater the net recharge. Pumping in the developed groundwater system is equal to net recharge, i.e., capture (Fig. 4 b). In addition to captured recharge and captured discharge, the depleted groundwater system (Fig. 4 c) also features captured storage (the dark brown block on the left). Net recharge is equal to captured recharge plus captured discharge. Pumping in the depleted groundwater system is equal to net recharge plus captured storage (Fig. 4 c). Diunduhdari: http://ponce.sdsu.edu/groundwater_sustainable_yield.html………….. 22/12/2012
HASIL AIR All ground water of economic importance is in constant movement through a porous rock stratum, from a place of recharge to a place of discharge. Available recharge is the sum of unrejected and rejected recharge . The unrejected recharge is the natural recharge; the rejected recharge is the portion of available recharge rejected by [portions of] an aquifer on account of being full (at least part of the time). To assure maximum utilization of the supply, Theis argued that groundwater development should tap primarily the rejected recharge and, secondarily, the evapotranspiration by non-productive vegetation. Thus, he defined perennial safe yield as equal to the amount of rejected recharge plus the fraction of natural discharge that it is feasible to utilize. According to Theis (1940), where rejected recharge is zero, the only way to replace the well discharge is by artificial recharge. The latter is the increase in recharge induced by human design. Diunduhdari: http://ponce.sdsu.edu/groundwater_sustainable_yield.html………….. 22/12/2012
HASIL AIR The age of the forest determines the amount of water runoff. The Soil/Water Hydrology Process (Source: Predicting Water Yields From Mountain Ash Forest Catchments’ Industry Report of the Co-operative Research Centre for Catchment Hydrology, April 1998. Fig 1, Pg 1.) Diunduhdari: http://www.oren.org.au/issues/water/report/8crcchtrees.htm………….. 22/12/2012
HASIL AIR . WATER YIELD MODEL The water yield model is based on the Budyko curve and annual average precipitation. First, we determine annual water yield (Yjx) for each pixel on the landscape (indexed by x = 1,2,...,X) as follows: where, AETxj is the annual actual evapotranspiration on pixel x with LULC j and P:sub:`x`* is the annual precipitation on pixel *x. Conceptual diagram of the water balance model used in the hydropower production model. The water cycle is simplified, including only the parameters shown in color, and ignoring the parameters shown in gray. Yield, as calculated by this step of the model, is then adjusted for other consumptive uses and applied to hydropower energy and value estimates. Diunduhdari: http://ncp-dev.stanford.edu/~dataportal/invest-releases/documentation/current_release/reservoirhydropowerproduction.html………….. 22/12/2012
HASIL AIR The evapotranspiration partition of the water balance, , is an approximation of the Budyko curve developed by Zhang et al. (2001): where, is the dimensionless Budyko Dryness index on pixel x with LULC j, defined as the ratio of potential evapotranspiration to precipitation (Budyko 1974) and is a modified dimensionless ratio of plant accessible water storage to expected precipitation during the year. As defined by Zhang et al. (2001) is a non-physical parameter to characterize the natural climatic-soil properties. where is the volumetric (mm) plant available water content. The soil texture and effective soil depth define , which establishes the amount of water that can be held and released in the soil for use by a plant, estimated as the product of the difference between field capacity and wilting point and the minimum of soil depth and root depth. Z is a seasonality factor that presents the seasonal rainfall distribution and rainfall depths. In areas of winter rains, we expect to have Z on the order of 10, in humid areas with rain events distributed throughout the year or regions with summer rains the Z is on the order of 1. While we calculate , in some cases specific biome values already exist based on water availability and soil-water storage (Milly 1994, Potter et al. 2005, Donohue et al. 2007). Finally, we define the Budyko dryness index, where values that are greater than one denote pixels that are potentially arid (Budyko 1974), as follows: where, ETox is the reference evapotranspiration from pixel x and is the plant (vegetation) evapotranspiration coefficient associated with the LULC j on pixel x. ETox represents an index of climatic demand while is largely determined by x‘s vegetative characteristics (Allen et al. 1998). The water yield model script generates and outputs the total and average water yield at the sub-basin level. Diunduhdari: http://ncp-dev.stanford.edu/~dataportal/invest-releases/documentation/current_release/reservoirhydropowerproduction.html………….. 22/12/2012
HASIL AIR Evaluating ecosystem services in production versus water yield and water quality in mountainous landscapes. Diunduhdari: https://www.bayceer.uni-bayreuth.de/terreco/………….. 22/12/2012
HASIL AIR Managing Arid and Semi-Arid Watersheds Matter is Not Created or Destroyed—The physical law of continuity stated simply is that "matter is neither created or destroyed". A given environment or ecosystem over a period of time receives an average input of precipitation and produces an average output of streamflow. The difference between these two amounts is basically what is used by the vegetation growing on the site. Because matter or in this example precipitation is neither created or destroyed, if one can change the amount of water used by the vegetation there will be more water available for streamflow or percolation into the soil. The key to increasing water yield is the replacement of deep-rooted or high water using plants with shallow-rooted or low water using plants. Differences in water use by shallow and deep rooted plants Diunduhdari: http://www.rmrs.nau.edu/watersheds/highlands/research.php………….. 22/12/2012
HASIL AIR WATER YIELD OPPORTUNITIES Water yield improvement, as it pertains to forest and rangelands, is based on the premise that streamflow and/or ground water are increased by an amount equal to the net reduction in evapotranspiration (Hibbert 1979). According to Hibbert, little opportunity exists to reduce transpiration where precipitation is less than about 460 mm(18 inches) (Figure from Hibbert) and is exceeded by potential evapotranspiration (warm, dry portions in figure ), because precipitation does not penetrate far into the soil, and one cover type is about as efficient as another in using the available water. The greatest opportunity to increase runoff by reducing transpiration exists where precipitation exceeds 460 mm (18 inches) and potential evapotranspiration (determined by the Thornthwaite method) exceeds 380 mm (15 inches). This kind of climate promotes vigorous growth of vegetation capable of using large amounts of water. Therefore, modifying plant cover under these conditions can substantially increase water yield. Vegetation and Rainwater Management Vegetation can be managed ways to reduce evapotranspiration: Decrease stand density by various practices to reduce transpiration and interception. Convert plant cover from one cover type to another that uses less water (type conversion). Create openings in forest cover to reduce transpiration and to redistribute snow, thus concentrating the rainwater to reduce evaporation, to increase snowmelt efficiency, and to enhance contributions to streamflow. Establish trees, large shrubs, or fences in windswept, treeless areas to pile snow in large drifts, thereby reducing evaporation losses from the rainwater. Diunduhdari: http://www.rmrs.nau.edu/watersheds/highlands/research.php………….. 22/12/2012
References Vitousek, P.M., J. Lubchenco, H.A. Mooney, J. Melillo. 1997. Human domination of Earth’s ecosystems. Science 277: 494-499. Daily, G.C. 1997. Nature’s Services: Societal Dependence on Natural Ecosystems. Island Press, Washington. 392pp. Marsh, G.P. 1864 (1965). Man and Nature. Charles Scribner, New York. 472pp. Osborn, F. 1948. Our Plundered Planet. Little, Brown and Company: Boston. 217pp. Vogt, W. 1948. Road to Survival. William Sloan: New York. 335pp. Leopold, A. 1949. A Sand County Almanac and Sketches from Here and There. Oxford University Press, New York. 226pp. Sears, P.B. 1956. “The processes of environmental change by man.” In: W.L. Thomas, editor. Man’s Role in Changing the Face of the Earth (Volume 2). University of Chicago Press, Chicago. 1193pp. Ehrlich, P.R. and A. Ehrlich. 1970. Population, Resources, Environment: Issues in Human Ecology. W.H. Freeman, San Francisco. 383pp. - see p.157 Ehrlich, P.R. and A. Ehrlich. 1981. Extinction: The Causes and Consequences of the Disappearance of Species. Random House, New York. 305pp. Daily, G.C. 2000. Management objectives for the protection of ecosystem services. Environmental Science & Policy 3: 333-339. Chichilnisky, G. and G. Heal. 1998. Economic returns from the biosphere. Nature 391: 629-630. Kremen, C. 2005. Managing ecosystem services: what do we need to know about their ecology? Ecology Letters 8: 468-479. Guo, Z.W., X.M. Xio and D.M. Li. 2000. An assessment of ecosystem services: water flow regulation and hydroelectric power production. Ecological Applications 10: 925-936.