Download

1 / 46
460 likes | 598 Views
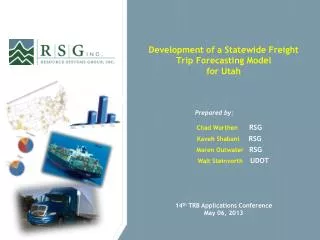
Development of a Statewide Freight Trip Forecasting Model for Utah. Prepared by :. Chad Worthen RSG. Kaveh Shabani RSG. Maren Outwater RSG. Walt Steinvorth UDOT. 14 th TRB Applications Conference May 06, 2013. Freight Model Components. Long-Haul

E N D
Development of a Statewide FreightTrip Forecasting Model for Utah Prepared by: • Chad Worthen RSG • Kaveh Shabani RSG • Maren Outwater RSG • Walt Steinvorth UDOT 14th TRB Applications Conference May 06, 2013
Freight Model Components Long-Haul Commodity Flow Freight Model Short-Haul Commercial Vehicle & Truck Model • Long-haul uses Transearch & socioeconomic data, short-haul uses socioeconomic data • Long-haul includes national component, short-haul is just statewide • Replaces the commercial and truck component in existing statewide model Details Introduction Model Steps Issues Closing
Geographic Scope Part 2: Statewide Zone Structure Part 1: National Zone Structure • ~3,500 zones • 284 zones Introduction Model Steps Issues Closing
MPO Integration USTM Connection to Cache USTM Connection to Dixie USTM Connection to Wasatch USTM External Node USTM Internal Node • Stand alone application added to USTM • To merge MPO model inputs to USTM inputs • Highway networks • TAZ shapefiles • SE data files • Trip tables • Creates sub-area networks Introduction Model Steps Issues Closing
Short Haul Generation Introduction Model Steps Issues Closing
Long Haul Generation Long Haul Trip End Model Estimation • Multivariate and multi-tier regression analyses • More than one trip generation equation for a commodity group • Better measures of fitness (RMSE, R2, t-stat, p-value) • Grouping counties based on reasonable characteristics (rural, urban, etc.) • Using some advanced outlier-detection methods • Overall measures of influence (Cook’s Distance and DFBETA) • Unusual observations (questionable employment or tonnages or ratio) • Regression both with and without outliers (and all reasonable combination of variables) Details Introduction Model Steps Issues Closing
Long Haul Generation • Too high? Sand and Gravel More than 200 active pits and quarries across the state! About 35 million tons of gravel, sand and crushed stone produced in 2009 Metallic Ores MNRL Nonmetallic Minerals Produced by commercial operators and by state and county agencies in most counties in Utah Introduction Model Steps Issues Closing
Friction Factors Short-Haul • Based on QRFM II and other area freight model • Exponential function form • Unique curve for light, medium and heavy Long-Haul • Calibrated using Transearch and national skims • Exponential, Gamma and Step function forms • Unique curve for each commodity • Unique set for internal-external movements (II, IX and XI) Note: internal-internal (II), internal-external (IX), external-internal (XI), and external-external (XX) Details Introduction Model Steps Issues Closing
Trip Length Frequency Validation (Example) Used step function to get the best match (MNRLs very important because of high total tons) Got a perfect match with a simple exponential function (several related friction factors also worked) One of the worst cases, ended up using a step function to get the best match Introduction Model Steps Issues Closing
Modes and Mode Share • Mode share not mode choice model • Long haul only • Modes • Truck – primary mode & purpose of model • Intermodal (IMX) – to identify truck element • Goods moved by combination of TRUCK and RAIL • Connections happen at railroad terminals • No ports and airports terminals • Other – modes not assigned • Pipeline and air • These modes are not assigned • Mode Share • Mode shares determined by Transearch • Exceptions: • Coal • Oil and gas Source: http://people.hoftsra.edu Details Introduction Model Steps Issues Closing
Mode Share by Commodity Group • Most II goods moved by truck • IX & XI goods have larger share moved by modes other than truck • Mineral, which had very high tonnage, is dominated by truck mode Introduction Model Steps Issues Closing
Payload Factor • Average tons/truck Utah allows very large bulk carrier trucks (doubles) that are not allowed by most states Note: Data is for medium and heavy trucks Source: Vehicle Inventory and Use Survey (VIUS, 2002) Source: Vehicle Inventory and Use Survey (VIUS, 2002) • Appeared unreasonably high • Almost double the national average Introduction Model Steps Issues Closing
Annual Factor • Average Working Days per Year • Distribution in truck counts shows stronger weekday trend • More important, validation suggests that goods are distributed 5 days/week regardless if goods shipped weekdays or weekends Details • Medium + Heavy Truck Counts Introduction Model Steps Issues Closing
Percent Empty • % Driven Empty with Utah Home Base • by commodity group (for heavy trucks) The % empty return trips were calculated using the following formula, applied to the transposed truck trip matrices. Source: 2002 VIUS database (note: some values interpolated) Details Introduction Model Steps Issues Closing
Truck Trip Summary SHORT HAUL Short-Haul Truck Trips (per day) • Gray text indicates data to be replaced by MPO models • Trips proportional to socioeconomic activity, most of which occurs in MPO areas • Internal short-haul trips inside MPO areas are replaced by data from MPO models Introduction Model Steps Issues Closing
Truck Trip Summary LONG HAUL Long-Haul Truck Trips (per day) Utah has a high percentage of external through trips (nearly half of all long-haul trips) Mineral commodity type dominate the internal truck trips All long-haul trips used by MPO models Introduction Model Steps Issues Closing
Traffic Count Validation Locations • 154 Truck Counts in Validation • 110 Arterial • 44 Freeway • 58 Truck Counts on Primary Freight Corridor • 28 Arterial • 30 Freeway Introduction Model Steps Issues Closing
Truck Classification Commercial Vehicle and Truck Classification FHWA Vehicle Classification Introduction Model Steps Issues Closing
Volume Validation • Primary Freight Corridor in Non-MPO Area Only • Corridor level validation still needed Details Introduction Model Steps Issues Closing
Long Haul Commodity Database • Long-haul freight highly reliant on commodity flow database (Transearch) • For certain commodities, Transearch data appeared suspect • Commodities: • Coal • Crude oil • Refined petroleum • Issue: • Total tons • Distribution • Mode share • Other data sources needed to validate/correct commodity flow data: • National • Energy Information Administration (EIA) • United States Bureau of Transportation Statistics (BTS) • Commodity Flow Survey (CFS) • Freight Analysis Framework (FAF3) • Local • Utah Geological Survey • Utah Division of Oil, Gas & Mining-Department of Natural Resources Introduction Model Steps Issues Closing
Coal Movement • Transearch had too much coal for Utah Total Tons • Distributed to wrong counties (in thousands) • Mode share close for IX & XI, but off for II Distribution Mode Share Introduction Model Steps Issues Closing
Crude Oil Movement • Transearch had zero crude oil for Utah Total Tons • Distributed to wrong counties (in thousands) • Mode share very different for II, IX & XI Distribution Mode Share Details Introduction Model Steps Issues Closing
Petroleum Products Movement Crude oil is produced at wells and attracted to refineries So Refined petroleum productions should be synced with the crude oil-refined petroleum products supply chain • Total tonnage >>> Not changed from Transearch Introduction Model Steps Issues Closing
Conclusions & Lessons Learned • Be aware of the limitations of data sources • Use local knowledge/judgment • Use publicly available data (e.g. EIA, FAF) for an economical way to overcome data limitations • Trade off between the level of detail needed and available resources Data Modeling • Trip-based freight method worked well for Utah • Not a lot of intricate modal details • Mostly interested in truck volumes on highways Future • Utah Freight Model is still a work in progress • MPOs implementing freight component • Corridor-level calibration needed Freight Introduction Model Steps Issues Closing
San Diego Evansville Chad Worthen, RSG chad.worthen@rsginc.com 801-456-4901 Kaveh Shabani, RSG kaveh.shabani@rsginc.com 801-456-4904 Maren Outwater, RSG maren.outwater@rsginc.com 414-446-5402 Walt Steinvorth, UDOT msteinvorth@utah.gov 801-965-3864
12 Long Haul Commodity Groups Long Haul • Forecast tons then convert tons to vehicles • National and Utah-based flows • Based on purchased commodity flow data (Transearch) and additional data (COAL, OLGA, PETR) Return
Commodity Group Detail Return
Long Haul Generation Variables Long Haul Trip End Model Estimation • Pivot off base-year Transearch data • Generation equations determine spatial location inside Utah & calculate "new" tonnage • Controls to interpolated Transearch data at state-level • Production & attraction variables differ slightly for internal & external movements Return
Regression Equations (IIP) ″II″ Production Return
Regression Equations (IIA) ″II″ Attraction Return
Regression Equations (IXP) ″IX″ Production Return
Regression Equations (XIA) ″XI″ Attraction Return
Intermodal Mode • Goods moved by combination of TRUCK and RAIL • Connections happen at railroad terminals (no ports and airports terminals) Locations in Utah IANA Intermodal Association of North America BTS Bureau of Transportation Statistics CTA by David Middendorf in 1998 Google Map 5 Locations 5 Locations 4 locations 5 Locations Distributing freight between Intermodal locations Based on each location’s storage area/tracks percentage of total Different for “Coal” and “Oil and Gas” (IX) Return Source: http://people.hoftsra.edu
Volume Validation • Primary Freight Corridor in Non-MPO Area Only • Using Annual Factor = 306 (instead of 260) Return 1 Return 2 Introduction Model Steps Issues Closing
Derivation of % Empty Truck Equation • In the VIUS survey, the driver was asked what % of the time did they drive empty. • This question presupposes the % of total trip time that was driven empty. • To calculate the number of truck trips driven empty, we apply the formulas outlined in this derivation. Return Introduction Model Steps Issues Closing
U.S. Crude Oil and Refined Products Pipelines Pipelines from Wyoming and Colorado Source: American Petroleum Institute (API) Return
Crude Oil Movement PADD • Generation & Mode Share :“Energy Information Administration” and “Utah Geological Survey” data • Distribution:crude oil is produced at wells and attracted to refineries PADD: PetroleumAdministrationfor DefenseDistricts PAD District 4 (Rocky Mountain) Colorado, Idaho, Montana, Utah, Wyoming Return Source: U.S. Energy Information Administration (EIA)