Download
1 / 23
270 likes | 418 Views
This document explores the electronic structure of mercury, its low melting point and volatility, as well as its biogeochemical cycling in the environment. The two stable oxidation states, Hg(0) and Hg(II), are discussed along with anthropogenic sources such as combustion and mining, which have significantly increased global mercury deposition since preindustrial times. The document details how human exposure to mercury primarily comes from fish consumption, highlighting the importance of understanding mercury's behavior in the atmosphere, soil, and oceans, and its toxic effects through biomagnification.

E N D
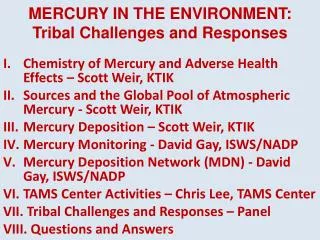
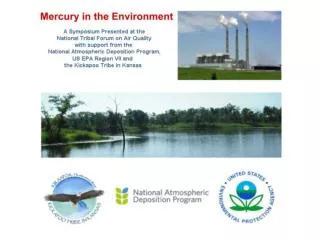
MERCURY IN THE ENVIRONMENT Daniel J. Jacob
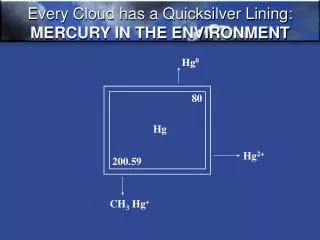
Electronic structure of mercury Mass number = 80: 1s2 2s2 2p6 3s2 3p6 3d10 4s2 4p6 4d10 4f14 5s2 5p6 5d10 6s2 • Complete filling of subshells gives Hg(0) a low melting point, volatility • Two stable oxidation states: Hg(0) and Hg(II)
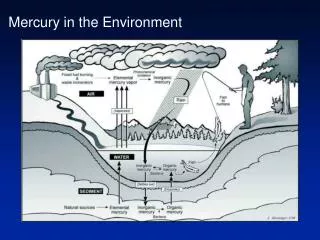
BIOGEOCHEMICAL CYCLING OF MERCURY ATMOSPHERE Hg (gas) combustion industry mining volcanoes erosion deposition re-emission SOIL OCEAN burial SEDIMENTS DEEP EARTH
Global mercury deposition has roughly tripled since preindustrial times RISING MERCURY IN THE ENVIRONMENT Dietz et al. [2009]
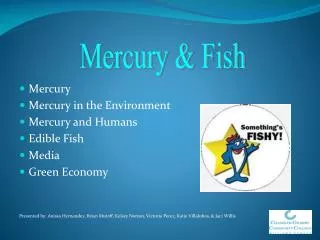
HUMAN EXPOSURE TO MERCURY IS MAINLY FROM FISH CONSUMPTION Tuna is the #1 contributor Mercury biomagnification factor State fish consumption advisories EPA reference dose (RfD) is 0.1 μg kg-1 d-1 (about 2 fish meals per week)
MERCURY CYCLING INVOLVES CHEMICAL TRANSFORMATIONS elemental mercury VOLATILE mercuric compounds WATER-SOLUBLE ATMOSPHERE Hg(0) Hg(II) oxidation deposition re-emission Hg(0) Hg(II) reduction SURFACE RESERVOIRS (Ocean, Land) microbes MeHg Methylmercury TOXIC
Atmospheric transport of Hg(0) takes place on global scale Implies global-scale transport of anthropogenic emissions Anthropogenic Hg emission (2006) Mean Hg(0) concentration in surface air: circles = observed, background = GEOS-Chem model Transport around northern mid-latitudes: 1 month Hg(0) lifetime = 0.5-1 year Transport to southern hemisphere: 1 year Streets et al. [2009]; Soerensen et al. [2010]
LOCAL POLLUTION INFLUENCE FROM EMISSION OF Hg(II) High-temperature combustion emits both Hg(0) and Hg(II) 60% Hg(0) GLOBAL MERCURY POOL photoreduction 40% Hg(II) NEAR-FIELD WET DEPOSITION Hg(II) concentrations in surface air: circles = observed, background=model MERCURY DEPOSITION “HOT SPOT” Large variability of Hg(II) implies atmospheric lifetime of only days against deposition Thus mercury is BOTH a global and a local pollutant! Selin et al. [2007]
Atmospheric redox chemistry of mercury Older models X X OH, O3, Cl, Br Hg(II) Hg(0) X ? HO2(aq) • Oxidation of Hg(0) by OH or O3 is endothermic • Oxidation by Cl and Br may be important: • No viable mechanism identified for atmospheric reduction of Hg(II) Goodsite et al., 2004; Calvert and Lindberg, 2005; Hynes et al., UNEP 2008; Ariya et al., UNEP 2008
GOME-2 BrO columns Bromine chemistry in the atmosphere Inorganic bromine (Bry) O3 hv BrNO3 Br BrO Halons hv, NO OH HBr HOBr Stratospheric BrO: 2-10 ppt CH3Br Thule Stratosphere Tropopause (8-18 km) Troposphere TroposphericBrO: 0.5-2 ppt CHBr3 CH2Br2 OH Bry Satellite residual [Theys et al., 2011] debromination BrO column, 1013 cm-2 deposition Sea salt industry plankton
TROPOSPHERIC BROMINE CHEMISTRYsimulated in GEOS-Chem global chemical transport model GEOS-Chem Observed Vertical profiles of short-lived bromocarbonsat northern mid-latitudes CHBr3 440 Gg a-1 CH2Br2 62 Gg a-1 Mean tropospheric concentrations (ppt) 0.09 0.6 0.3 hv, OH BrNO3 CHBr3 Br BrO 14 days OH including HBr+HOBr on aerosols HBr CH2 Br2 HOBr 91 days Sea salt 1.4 0.9 debromination industry OH CH3Br deposition plankton 1.1 years Parrella et al. [2012]
GEOS-Chem global model of mercury 3-D atmospheric simulation coupled to 2-D surface ocean and land reservoirs GEOS-Chem 3-D atmospheric chemical transport model (CTM) • 2-D surface reservoirs • ocean mixed layer • vegetation Anthropogenic and natural emissions Hg(0)+Br ↔ Hg(I) → Hg(II) • Long-lived reservoirs • deep ocean • soil
MERCURY WET DEPOSITION FLUXES,2004-2005 Circles: observations Background: GEOS-Chem model tropopause Scavenging of Hg(II)-rich air from upper troposphere Model contribution from North American anthropogenic sources Model contribution from external sources updraft FLORIDA SCAVENGING BY DEEP CONVECTION Selin and Jacob [2008]
Historical inventory of global anthropogenic Hg emissions Large past (legacy) contribution from N. American and European emissions; Asian dominance is a recent phenomenon Streets et al. , 2011
1977-2010 surface air trend of Hg(0) over the Atlantic Ocean • 1990-2010 data from ship cruises show 50% decrease over North Atlantic, no significant trend over South Atlantic • Long-term observations at continental sites in N America and Europe also show 1990-2010 decrease though not as strong as over North Atlantic Sørensenet al., submitted
GEOS-Chem simulation of Hg(0) 1990-2010 trends in surface air Global 3-D atmospheric model coupled to 2-D surface ocean and land models Forced by Streets emission trends Forced by observed subsurface Atlantic trends ng m-3 a-1 • Observations in the subsurface North Atlantic show a 80% decrease from 1990 • to 2010 [Mason et al., 2012], which can explain the observed trends in surface air • This must reflect a large decline in Hg inputs to the North Atlantic Ocean over • the 1970-2010 period. Sørensenet al., submitted
Decreasing Hg input to subsurface North Atlantic, 1970-20001. Atmospheric deposition explanation 1970 2000 Hg(0) Hg(0) Br Br marine boundary layer Hg(0) Hg(II) Hg(0) Hg(II) fast slow ocean mixed layer subsurface ocean (down to thermocline) • Hg deposition to ocean is driven by MBL oxidation of Hg(0) by Br atoms • MBL ozone ~doubled during 1970-2000; Br concentrations would have correspondingly decreased (Br/BrO photochemical equilibrium) O3 BrO Br h Sørensenet al., submitted
Decreasing Hg input to subsurface North Atlantic, 1970-20002. Coastal margin explanation 1970 2000 Disposed Hg-containing commercial products incineration Hg(II) Hg Hg wastewater, leaching Hg • Secondary wastewater treatment and phase-out of Hg from commercial products would have decreased the Hg input to the subsurface N Atlantic Sørensenet al., submitted
Disposal of Hg in commercial products:a missing component of the Hg biogeochemical cycle? Global source of commercial Hg peaked in 1970 Streets et al. [2011] and Hannah Horowitz (Harvard)
7-box model with 7 coupled ODEs dm/dt= s(t) – km where s is primary emission • Loss rate constants k specified from best knowledge Global biogeochemical model for mercury Primary emissions Model is initialized at natural steady state, forced with historical anthropogenic emissions for 2000 BC – present; % present-day enrichments are indicated Amos et al., submitted
Time scale for dissipation of an atmospheric emission pulse Reservoir fraction Pulse gets transferred to subsurface ocean within a few years and stays there ~100 years, maintaining a legacy in the surface ocean Amos et al., submitted
Global source contributions to Hg in present-day surface ocean emissions pre-1850 natural • Human activity has increased 7x Hg content of the surface ocean • Half of this human influence is from pre-1950 emissions • N America, Europe and Asia share similar responsibilities for anthropogenic Hg in surface ocean ROW former USSR N America S America Europe Asia Amos et al., submitted
Negotiations to be completed by 2013 Looking toward the future: UNEP global treaty for Hg Effect of zeroing global anthropogenic emissions by 2015 • Zeroing anthropogenic emissions would decrease ocean Hg by 30% by 2100, while keeping emissions constant would increase it by 40% • Elevated Hg in surface ocean will take centuries to fix; the only thing we can do in short term is prevent it from getting worse. Amos et al., submitted