Microgravity Environment at EXPRESS Rack 4 (ER4 )
110 likes | 252 Views
Microgravity Environment at EXPRESS Rack 4 (ER4 ). Advanced Plant Habitat (APH). Kevin McPherson Eric Kelly Jennifer Keller Ken Hrovat. Outline. SAMS/MAMS Acceleration Data SAMS/MAMS Sensor Locations Microgravity Environment Components Three Aspects to Consider

Microgravity Environment at EXPRESS Rack 4 (ER4 )
E N D
Presentation Transcript
Microgravity Environmentat EXPRESS Rack 4 (ER4) Advanced Plant Habitat (APH) Kevin McPherson Eric Kelly Jennifer Keller Ken Hrovat
Outline SAMS/MAMS Acceleration Data SAMS/MAMS Sensor Locations Microgravity Environment Components Three Aspects to Consider Vibratory Characterization of EXPRESS Rack 4 Quasi-Steady Characterization of EXPRESS Rack 4 Roadmaps for the Microgravity Environment Brief Characterization of Some Disturbances
NASA GRC Capabilities and Services process & analyze 24x7 NASA SAMS & MAMS stream acceleration data from the ISS to NASA GRC • Web access to: near real-time displays, acceleration archives, and tailored off-line requests • http://pims.grc.nasa.gov • pimsops@grc.nasa.gov • >10TB Accel. Archive
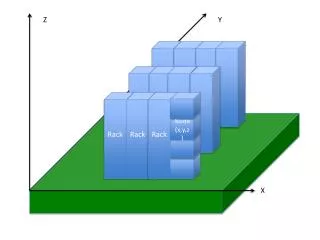
SAMS/MAMS Sensor Locations SAMS SE F02, MSG upper left seat track SE F03, ER2 lower Z panel SE F04, ER1 lower Z panel SE F05, ER4 drawer 2 SE F08, ER3 seat track TSH-ES05, CIR TSH-ES06, FIR ----------------------------------------------- MAMS in ER1(OSS and HiRAP)
SAMS More Localized with Increasing Frequency MAMS Global (rigid body) Microgravity Environment Components a generic label NOT intended to quantitatively characterize platform
Three Aspects to Consider • Spatial • Where is your location of interest (module/rack)? • High-frequency vibrations tend to be localized, so request SAMS sensor as close as possible to your location. • Low-frequency vibrations tend to be global. MAMS data can be mathematically mapped to your location. • These slides focus on EXPRESS Rack 4 (ER4) in JEM. • Temporal • When do you expect to operate? • Relative quiet below ~6 Hz during crew sleep. • Some investigators leverage crew sleep for sensitive periods. • You “batten down the hatches” during reboost perhaps. • Spectral • Any resonances or sensitivities? • Fruit fly investigation has sensitivity between ~140-200 Hz. • Marangoni liquid bridge experiment sensitive ~0.25 Hz.
Vibratory Characterization of EXPRESS Rack 4 • Comparison of GMT 06-Jun-2013 to 07-Jun-2013 (f < 200 Hz): • Each plot on the left is spectral summary for that day. • The black, dashed rectangle highlights portion of the acceleration spectrum from ~140-200 Hz. Spectrum for this sensor location is relatively stationary over the month analyzed for ER4. • To see this in more detail, view the following link (a 30-page PDF) in flipbook fashion and focus on the frequency range from 140 Hz to 200 Hz: • http://pims.grc.nasa.gov/plots/user/etchells/2013_06_30_121f05_pcss_roadmaps500.pdf • For lower frequency concerns, where the changes are much more subtle, see analogous summary at this link: • http://pims.grc.nasa.gov/plots/user/etchells/2013_06_30_121f05one_pcss_roadmaps142.pdf Power Spectral Density Frequency (Hz) See pages 16 & 20 at following link for follow-up on question about the units of Power Spectral Density (PSD): http://pims.grc.nasa.gov/MMAP/PIMS_ORIG/MEIT/MEIT_pdfs/meit2004/Section_13.pdf
Quasi-Steady Characterization of EXPRESS Rack 4 • MAMS Quasi-Steady Measurements for June 2013: • X-, Y-, and Z-axis components of quasi-steady (below 0.01 Hz) acceleration vector vs. time for the entire month (mapped to SAMS sensor location at ER4 in the JEM). • The red, mean valuesshow mean values derived from ISS rates/angles data for the month: • X = -0.023 ug, Y = 0.105 ug, Z = -0.350 ug • To see this in more detail, view the link below: • http://pims.grc.nasa.gov/plots/user/etchells/2013_06_one_month_ossbtmf_radgse_map2er4.pdf
Web-Based “Roadmap” Resources • Consider the following timeline: • ARCHIVE (lags real-time by 2 days): • See roadmap spectrograms for SAMS ER4 Sensor (121f05) at: http://pims.grc.nasa.gov/roadmap • Navigate PIMS roadmaps with calendar view for last ~12 years! • BUFFER (most recent 48 hours): • Roadmap Spectrograms for SAMS ER 4 Sensor (121f05) at: http://pims.grc.nasa.gov/plots/user/buffer • Browse most recent 2 days of screenshots from real-time. • REAL-TIME (most recent ~2 hours): • Roadmap Spectrogram for SAMS ER4 Sensor is updated at: http://pims.grc.nasa.gov/html/121_f05/PIMS_ISS_color.html • This automatically refreshes in browser.