Download
1 / 1
20 likes | 130 Views
Learn how glaciers are shrinking rapidly using ArcGIS, Landsat imagery, and GIS software to visualize and analyze changes over time affecting sea level rise. Educational module for high schoolers.

E N D
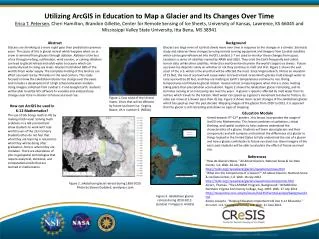
Utilizing ArcGIS in Education to Map a Glacier and Its Changes Over Time Erica T. Petersen, Cheri Hamilton, Brandon Gillette, Center for Remote Sensing of Ice Sheets, University of Kansas, Lawrence, KS 66045 and Mississippi Valley State University, IttaBena, MS 38941 Abstract Glaciers are shrinking at a more rapid pace than predicted in previous years. The cause of this is glacial retreat which happens when ice or snow is removed from glaciers through ablation. Ablation is the loss of ice through melting, sublimation, wind erosion, or calving. Ablation can lead to glacial retreat and adds water to oceans which can eventually lead to rising sea levels. Glaciers hold about 69% of the world’s fresh water supply. The complete melting of this land ice can affect sea level rise by 70 meters in the next century. This study focused on how the Jakobshavn Glacier has change over the years and includes a development of a high school education module. Using imagery collected from Landsat 1-7 and Google Earth, students will be able to utilize GIS software to visualize and analyze these changes over time in relation to future sea level rise. Background Glaciers are large rivers of ice that slowly move over time in response to the changes in a climate. Scientists study and observe these changes by using remote sensing equipment and imagery from Landsat satellites which can be geo-referenced into ArcGIS. Landsat 1-7 are used to monitor these changes from space. Landsat is a series of satellites started by NASA and USGS. They orbit the Earth frequently and collect terrain data unlike other satellites. Antarctica and Greenland contain the world’s largest ice sheets. Future sea level rise depends solely on whether or not they continue to melt and thin. Figure 1 shows the east coast of the U.S. which is the area that will be affected the most. Since Virginia Beach, VA has an elevation of 15 feet, the rise of sea level will cause water to travel inland. Greenland's glaciers hold enough water to raise sea level by 20 feet, and they are melting as Earth’s temperatures continue to rise. Rising temperatures contribute to glacial retreat. Glacial retreat simply happens when there is more melting taking place than precipitation accumulation. Figure 2 shows the Jakobshavn glacier retreating, and its terminus moving at an increasing rate over the years. A glacier’s speed is affected by melt water from its surface which travels to the bottom. Melt water can speed up a glacier’s movement but due to friction, its sides can move at a slower pace than its top. Figure 3 shows more recent changes of the Jakobshavn glacier which has sped up over the past decade. Mapping images of the glacier from 2010 to 2012, it is apparent that the glacier is still retreating and shows no signs of stopping. Figure 1. East coast of the United States. Cities that will be affected by future sea level rise. Virginia Beach, VA is number 6. (NOAA) How can ArcGIS be used in K-12 Mathematics? The use of GIS brings math to life by making math visual. Solving math problems in a GIS environment allow students to work with real-world issues of the 21st Century. Students often do not feel that what they are learning is relevant to what they will be doing after graduation. Here is where they are mistaken. There are abundance of jobs in geospatial technologies that require analytical, statistical, and computational skills that are learned in mathematics. Education Module Aimed towards 9th-12th graders , this lesson incorporates the usage of ArcGIS into Mathematics. This lesson combines visualization, critical thinking, and spatial analysis to help students understand the characteristics of a glacier. Students will learn about glaciers and their components and will compare and contrast the differences of a glacier to things located in the United States to fully understand the size of a glacier and how a glacier contributes to future sea level rise. Given imagery of the east coast students will be able to calculate the effect of future sea level rise. References "How do Glaciers Move." All About Glaciers. National Snow & Ice Data Center, n.d. Web. 16 July 2012. http://nsidc.org/cryosphere/glaciers/questions/move.html "What Are the Components of a Glacier?" All About Glaciers. National Snow & Ice Data Center, n.d. Web. 16 July 2012. http://nsidc.org/cryosphere/glaciers/questions/components.html Alcorn, Thomas. "The LANDSAT Program, Background." NOVAOnline. Northern Virginia Community College, Aug. 2007. Web. 17 July 2012. http://novaonline.nvcc.edu/eli/evans/his135/Events/Landsat/background.html Kerski, Joseph J. "Helping Educators Implement GIS into K-12 Education." Esri.com. U.S. Geological Survey, n.d. Web. 21 June 2012. Figure 2. Jakobshavn glacial retreat during 1850-2010. Photo by Steven Goddard, wordpress.com Figure 3. Jakobshavn glacial retreat during 2010-2012. (Landsat 7 images in ArcGIS)