Download
1 / 10
100 likes | 256 Views
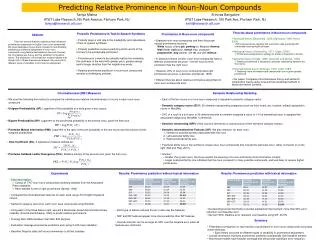
Soccer Games Results Prediction. ECE 539 – Introduction to Artificial Neural Networks and Fuzzy Systems Henrique Parreiras Couto . Background. The first division of Brazilian soccer league includes 20 teams Every team plays against all others twice Total of 380 games per year

E N D
Soccer Games ResultsPrediction ECE 539 – Introductionto Artificial Neural Networks andFuzzy Systems Henrique Parreiras Couto
Background • The first division of Brazilian soccer league includes 20 teams • Every team plays against all others twice • Total of 380 games per year • The championship format was different before 2003
Project Goal • Predictthe score ofany match ofthefirstdivisionoftheBraziliannationalchampionshipusing a Multi-layerperceptron.
Data Extraction • Public study about the market value of Brazilian teams Source: http://www.pluriconsultoria.com.br/relatorio.php?segmento=sport&id=263
Data Extraction • Publically available game results from 2003 through 2012 • Python program was used to extract and format the data into .txt files according to each team (with Alberto Tavares) • http://www.bolanaarea.com/gal_brasileirao.htm
Feature Vectors • MATLAB program used to assembly the data • Home Team • # of matches playedsince 2003 • Home goals for • Home goalsagainst • Market value • Away Team • # of matches playedsince 2003 • Awaygoalsfor • Awaygoalsagainst • Market value
FeatureVectors - Labels • [1 0 0 0 0] – Largeloss • [0 1 0 0 0] – Smallloss • [0 0 1 0 0] – Tie • [0 0 0 1 0] – Smallvictory • [0 0 0 0 1] – Largevictory
FeatureVectors • Training andTesting files • 380 featurevectorseach
Score prediction • Classifierresultgivesthedifferencebetweenthenumberofgoalsofeachteam • Final score predictionbasedontheclassifierresultandaveragenumberofgoalsscoredbyeachteamsince 2003.
Results • Averageclassification rate ofthe MLP : ~40% • Improvementsneeded