Download
1 / 29
290 likes | 500 Views
Development of NDT Inspection Techniques For Heavy Wall Stainless Steel Piping. Presented to National Pressure Equipment Conference February 9 – 11, 2005. Presented by: Larry Bartley - Canspec Group Inc. Plant Services Coordinator. Acknowledgements. Brian Beresford Canspec Group Inc.

E N D
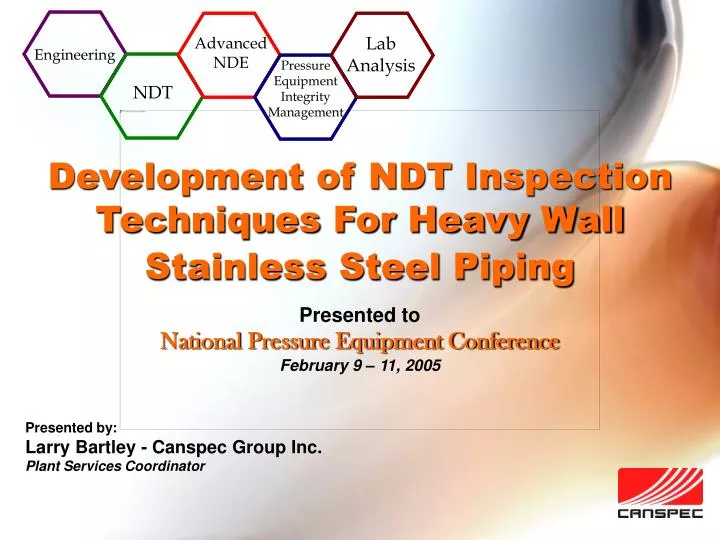
Development of NDT Inspection Techniques For Heavy Wall Stainless Steel Piping Presented to National Pressure Equipment Conference February 9 – 11, 2005 Presented by: Larry Bartley - Canspec Group Inc. Plant Services Coordinator
Acknowledgements • Brian Beresford Canspec Group Inc. • David Mackintosh Canspec Group Inc. • Wayne Smith Oxy Vinyls, Canada • Hang Zheng Canspec Group Inc. • Gary Kroner Carbon Steel Inspection
Overview • Introduction • Detection method • Probe development • Test standard • Inspection of the test pipes • Analysis technique • Conclusions
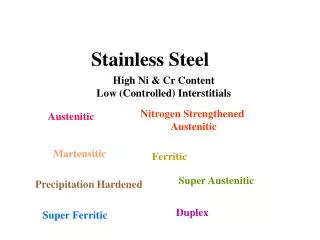
Introduction • Canspec developed a nondestructive examination method for SA-312 TP 316L SS pipes: • NPS 3 in. diameter (0.121 in. wall thickness) and • NPS 6 in. diameter (0.146 in. wall thickness). • Examine pipes while in operation • Pipes in horizontal position • Pipes had been used to carry liquid vinyl chloride monomer (VCM) at 150 psig and approximately 17C since 1996. • Pipes were known to have corrosion pits on the internal surface.
Corrosion mechanism • Water condensates containing chlorides tended to gather at the bottom of the pipe, causing pitting on the internal surface. • Inside the pits, water and high concentrations of chloride ions collected. • Corrosion rate inside pits increased, eventually caused a large cavity inside the pipe wall.
Sample NPS 3 in. diameter test piece
Choice of NDE Method • Factors in decision: material, size of pipes, type of defects • Eddy current was considered to be the best choice. • Eddy current has good sensitivity to corrosion pits on the pipe internal surface while scanning from the outside. • Eddy current allows a fast and efficient inspection of the pipes while the plant is in operation.
Probe Development • Probe consisted of a differential coil embedded in a hand-held housing. • Two stainless steel bars maintained constant clearance between the coils and the pipe surface and provided wear resistance • Probe is hand-held for easy scanning along the pipe surface.
Test Standard • A section of the test pipe (NPS 3 in.) was longitudinally split in half and one half was made to be a test standard piece. • Defects: four 3/64 in. (0.047 in.) diameter drilled holes of depths 100%, 75%, 50% and 20% wall. • Natural corrosion pit about 0.05 in. diameter, 0.032 in. deep (26% wall loss) • Tests indicated good sensitivity to the shallowest hole (20% wall loss). • The calibrated test system could detect and size the natural pit.
Permeability variation • A simulated permeability variation was also added to the test standard piece. • Objective: to set the system to differentiate irrelevant indications due to permeability variations.
Inspection Results —Flaws detected: • Through-wall pinhole • Inside diameter indication, 90% wall-loss pit. • Inside diameter indication, 20% wall-loss pit. (All above defects located at the bottom of the pipe.)
Visual Verification • Pipe was longitudinally split in half, and internal surface was cleaned by wire brush. • Small diameter pits could be seen at locations predicted by eddy current examination.
Results from the Pit Called at 90% • Metallographic examination revealed a 1 mm diameter opening on the pipe internal surface. • Inside the pipe wall, the pit broadened to an area of 3.5 × 5 mm. • Wall loss was physically measured to be 90%.
Scanning electron microscope (SEM) image of the cross section of the 90% pit.
Results from the Shallow Pit • Diameter 0.04 in., depth 0.020 in. (17% wall loss). • Results verified that the system met the required sensitivity to 25% wall loss.
Inspection of the Test Pipes (cont’d) View of the 20% pit from the internal surface • The second indication was a 0.04 in. diameter, 0.020 in. deep pit which accounted for a 17% wall loss. More importantly, the system could detect a pit where the wall loss was as small as 17%, which met the required 25% wall loss criteria.
Analysis Technique Data Analysis • An inspection and analysis procedure was developed specifically for the pipes to be inspected. • The procedure detailed the equipment required, the calibration standard, the operation parameters and procedure. • Methods of identifying irrelevant indications were specifically addressed.
Analysis Technique (Cont’d) • ASME standard 100% 60% 20%
Analysis Technique (Cont’d) • Permeability Mix Standard Perm 100% Test Pipe
Analysis Technique (Cont’d) • Defect in test pipe 17% wall loss
Continued NDE • Inspection of another NPS 3 in.-diameter pipe in the plant showed an indication different from pit-like indication. • Subsequent metallographic examination of this area revealed longitudinally-oriented crack-like defects associated with corrosion. • The defects were up 0.025 in. deep inside the pipe, which accounted for a 20% wall loss.
Conclusions • Pitting was caused by chloride corrosion as a result of moisture in the liquid VCM in the pipe. • The wall loss measured from the cross section of the pit was 90%, which confirmed the eddy current inspection results. • The inspection system can detect pits larger than 20% wall loss, which meets the 25% wall loss criteria required by the customer.
Conclusions • The system can give a reasonably good estimation of the amount of wall loss and the size of a pit within its resolution ranges. • The system can also detect crack-like defects associated with corrosion. • The system has the ability to eliminate false indications caused by permeability variations.
Thank You (www.canspec.com)