Download
1 / 16
160 likes | 256 Views
Understand the differences between tax expenses, payments, and rates in financial statements, considering GAAP and Tax Code regulations. Learn to calculate effective and actual tax rates and identify revenue quality issues through indirect tax evidence.

E N D
Analyzing the Tax Rate ACTG 6920 Session 3 Professor Kile
Analyzing the Tax Rate The Tax Expense reported on the income statement is a taxable amount based upon earnings as measured by GAAP. The amount of taxes actually paid is a taxable amount based upon earnings as measured by Tax Code.
Analyzing the Tax Rate The amount of taxes paid on the income statement is a GAAP (financial reporting) Measure- not the actual amount of taxes Paid.
Analyzing the Tax Rate To determine the amount of taxes actually Paid, one must find “Current Tax” in the Footnotes. Examples: Pacific Sunwear of California Buckle
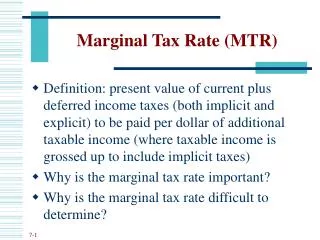
Creating a Tax Worksheet • Open the tax spreadsheet; • Create a table containing the marginal tax rates • Federal = 35% • Additional State Taxes = ( + ) • Foreign Differential * = ( - ) • Create a table containing the effective tax rates • Create a table containing the actual tax rates
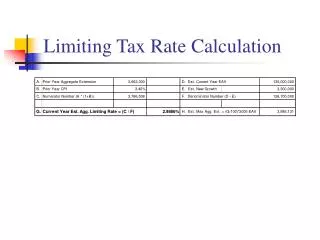
Calculating the Tax Rate Effective Tax Rate = Tax Expense divided by Earnings Before Tax Example: Kohls
Calculating the Tax Rate Problems with using the Effective Rate Examples: Citigroup (2006 – 2008)
Calculating the Tax Rate An alternative is to consider the default Rates. Example: Phillips-Van Heusen But, sometimes these are given in Amounts Examples: Citi Trends Pacific Sunwear of California
Indirect Evidence – Tax Footnote Tax Deferred Asset: Created when IRS>GAAP Tax Deferred Liability: Created when GAAP>IRS
Big Bath – Tax Valuation A build up of Deferred Tax Liability may signal a revenue or earnings quality issue.
Indirect Evidence of Revenue Quality Build-up of Tax Deferred Liabilities: Over time, GAAP income & IRS income should mostly balance out and thus, track each other. Build-ups of Tax Liabilities could indicate that companies are accelerating the recognition of revenue or are managing earnings upward.
Indirect Evidence of Revenue Quality Such build-ups in Tax Liabilities occurred During the 1990s, prior to the market “corrections” of 2000 – 2002 and during the years prior to the 2008 market decline. According to CFO Magazine, the gap between the two numbers rose from Negligible in 1992 to $93 billion in 1996 To $160 billion in 1998 (1/4th of reported income)
Big Bath – Tax Valuation A build up of Deferred Tax Assets may signal a big bath
Big Bath – Tax Valuation A Tax Valuation Allowance occurs when asset realization is doubtful. (remember that “assets are expenses waiting to happen”). When the valuation is removed It becomes an immediate expense. EXAMPLES: Men’s Wearhouse, General Motors, Citigroup