Download
1 / 30
300 likes | 318 Views
Explore the regulatory issues and vulnerabilities in the Florida insurance market, focusing on catastrophe insurance. Evaluate the impact of potential hurricane events and discuss strategies to strengthen the system.

E N D
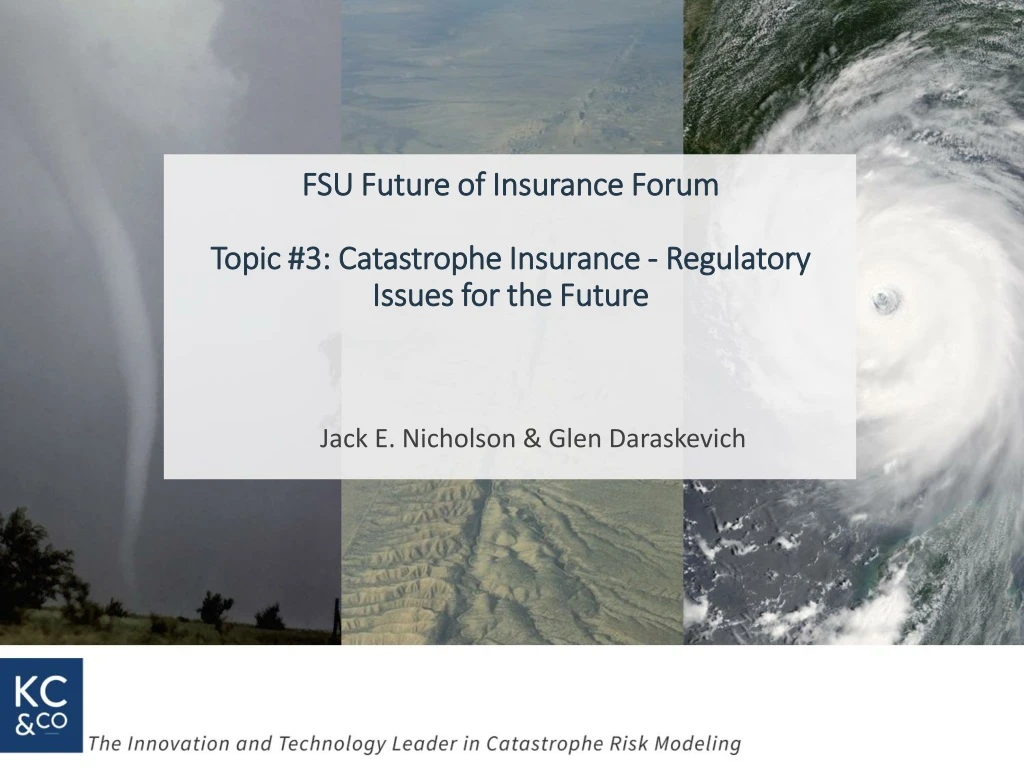
FSU Future of Insurance ForumTopic #3: Catastrophe Insurance - Regulatory Issues for the Future Jack E. Nicholson & Glen Daraskevich
Agenda • Provide an overview of Nicholson, J.E., Clark, K., & Daraskevich, G. (2018). The Florida insurance market: An analysis of vulnerabilities to future hurricane losses. Journal of Insurance Regulation, 37(3), 1-33. • Purpose of the study was to: • Evaluate vulnerabilities and risk associated with the Florida insurance system and capabilities to respond to reasonable (not just extreme) hurricane events. • Quantify potential impacts from hurricane events at two resolutions • Micro - impact to individual Florida companies, and • Macro - impact to system as a whole including Florida’s Public Risk Financing Entities (Citizens, FHCF, FIGA) • Illustrate how system can be strengthened • By introducing new risk management approaches for insurers • By proactively manage vulnerabilities and risk inherent in the design of the system, and • By the on-going collection and analysis of data
Florida is a Peak Hurricane Region and its Only a Matter of Time Before the Next “Big One” • Since 1900, 70 landfalling hurricanes or 1/3 US total in Florida • 2 of 3 CAT 5 US mainland hurricanes, & 40% of all CAT 4 hurricanes • On September 7, 2017 Hurricane Irma was projected to be a CAT 4/5 hurricane with potential damages of $180 billion primarily in Florida, fortunately the storm weakened and path changed from projections. • Results could have been massive insolvencies to the extent of exhausting the capabilities of FIGA to pay policyholder claims.
Literature Review of Past Studies on Florida Catastrophe Insurance Regulation • Very little research done to test viability of current methods of evaluating insurers (the PML Approach). • No studies have evaluated an insurance system as a whole • Biggest hurricane $12 billion (single event – Wilma) since Hurricane Andrew. • Florida Commission on Hurricane Loss Projection Methodology (FCHLPM) created in 1995 to develop standards and to review models for ratemaking and probable maximum loss (PML) purposes. • PML differences between models can be a factor of 2. • Individual models can differ significantly from year to year -- mostly based on expert judgements and assumptions (not necessarily based on new scientific information).
Create a large sample of hypothetical events Where? How big? How frequent? For each event estimate intensity at each location Based on intensity and exposure at each location estimate damage Apply policy conditions to estimate insured losses Catastrophe Model Fundamentals and the Loss Exceedance Probability Curve Catastrophe Model Results – Loss Table Catastrophe Model Sim Year Event ID Loss ($ million) Event Generation 1 1 2 3 . . 1 2 1 1 . . 253 41 5 1627 . . Intensity Vulnerability Catastrophe Model Results – Loss Exceedance Probability (EP) Curve Probability p(L) that losses will exceed L Financial 1 in 100 1% 1 in 250 .4% Loss, L
Issues with the Probable Maximum Loss (PML) Metric • Due to lack of historical data, many assumptions have to be made by catastrophe model vendors. Significant uncertainty around the probability results. • Despite the uncertainty in the EP curves, the insurance industry has gravitated to one point on the curve – the 1% loss exceedance or the 1 in 100-year PML. • The 100-year PML is used by rating agencies (Demotech) to assign solvency ratings and by the regulator (FLOIR) in the review of financial strength. • BUT • PML does not provide a consistent yardstick for comparing companies • PML can vary by a factor of 2 between models. • PML is not transparent since models are proprietary and “black boxes” to model users. • Model versions can change significantly therefore models do not provide a “stable currency.” • Insurers can “model shop” to find the one that has the lowest PML. • PMLs can mask exposures giving insurers a false sense of security • Relying on traditional model output is not a robust rating methodology and the use of PMLs lacks consistency, transparency, and stability.
Trends in the Florida Residential Property Insurance Market Since Hurricane Andrew • In 1993, State Farm and Allstate wrote over 50% of the policies in the market • There were 288 insurers operating in the state in 1993 • In 2017 there were about 160 insurers • Breakdown as of year-end 2016 by policyholder market share and surplus is as follows • Citizens with 5% of policyholders, $7.4 billion surplus • Florida-based domestic insurers with 71%, $5.2 billion surplus • Florida-based subsidiaries of national writers with 11%, $1.5 billion surplus • Foreign-based national writers with 13%, $158.2 billion surplus
Trends in the Florida Residential Property Insurance Market Since Hurricane Andrew, cont.
Florida Citizens Have Particular Vulnerabilities to Hurricane Risk • The public is the financial backstop for Florida’s public risk financing entities • Citizens – a state residual market insurer • FHCF – a type of state operated reinsurer • FIGA – an entity to pay claims of insolvent property and casualty insurance companies • What they have in common is the financing of losses with debt using premium assessments on the public • Potential vulnerabilities associated with hurricane losses • Florida exposure of $2.2 trillion for residential property insurance • The citizens of the state are vulnerable due to • Lack of transparency of insurers’ reinsurance programs • Exposure concentrations • PML levels • The risk and limitations of Florida’s Public Risk Financing Entities • Other risk factors • Risk transfer market volatility • Financial market volatility • “Clash financing problem” among Florida’s Public Risk Financing Entities • Insurer reliance on FHCF claims-paying capacity estimates • The problem of a sharp drop off in FHCF’s capacity for a subsequent season
Overview of the Analysis • Two part study • Micro, looked at 62 Florida Domestic Insurers • Macro, looked at the Insurance System to include the impacts of hurricanes on Citizens, the FHCF, and FIGA • Hurricane losses were estimated utilizing the Characteristic Event Methodology (Karen Clark & Co., 2014) • Unique spatially complete set of hurricane events – landfall points positioned at 10-mile increments along the entire coast of Florida. • At each point, storms representing the characteristic of three types of events are simulated – 20, 50, & 100-year hazard probability event. • Note: No extreme scenarios (i.e. 250 or 500-year) • Intent is to investigate vulnerabilities from events having a reasonable likelihood of occurring. • Hurricane risk changes along the Florida coast. For example 100-year event in SE Florida is a Cat 5 hurricane and for NE & NW Florida it is a Cat 4.
Characteristic Events (CEs) Are Scientifically Defined Using the Historical Data and Meteorological Expertise Relative Wind Speed High Low
CEs Represent the Hazard Probability at Each 10 Mile Landfall Point Important Concept: CE parameters change with landfall point 100 Year CEs in Northwest FL Florida is divided into three regions based on climatology 150 mph 165 mph
CEs Address Sampling Issues Present with Randomly Generated Tracks and Peak Winds Included in Traditional PML Approaches Randomly Generated Cat 5 Events 100 Year CEs Vmax=165
CE Event Set Systematically Identifies Scenarios that Pose the Greatest Threats to Surplus of Individual Insurers or the Entire Florida Market d 100 Year PML
Generating Exposure Data for the Individual Company Micro Analysis • The authors utilized FLOIR QUASR data for each FL insurer as of the fourth-quarter 2016 • Policy type, number of policies that include wind coverage, TIV at a county resolution • To generate more accurate loss estimates, the provided data was augmented and then distributed to a ZIP code centroid resolution utilizing KCC industry exposure data sets • Each company’s policies were distributed to ZIP codes in the same proportion as the industry • Occupancy type was derived from QUASR data • Construction type, year built, deductible amount and coverage split assumptions were chosen to match industry patterns in each ZIP code • To benchmark the accuracy of the exposure data assumptions, CE loss estimates were compared for sample companies that the authors also had individual property information including street address coordinates, building attributes, and deductible information • The exhibits compare the 100 year CE profile for three sample companies • Red line - Zip Code Centroid Green line – Street Address Geo Code
Micro Analysis – Normalized Solvency Ratio (NSR) Quantifies Individual Insurer Financial Strength Top of FHCF + Private Reinsurance Program set to 75% of the KCC 100-year model generated PML
NSR Results for Florida Insurers • NSR > 0, an insurer is expected to have an expected positive surplus from the 100-year events. • NSR < 0, an insurer is expected to have an expected negative surplus from the 100-year events. • Results for Florida Domestics -- 62 insurers studied • 26 (42%) positive NSRs • 36 (58%) negative NSRs • 8 (13%) negative NSRs <-2, will not be able to survive many 50-year and some 20-year events • NOTE: All have the same “A” or better rating by Demotech methodology which relies heavily on PML – which does not differentiate between insurers.
Number of Florida Domestic Insurers by NSR Band 26 Insurers 28 Insurers 8 Insurers
Distribution of Florida Domestic Insurers by NSR Band and Policy Count
CE Profiles and NSRs forThree Florida Insurers NSR = 0.07 • The exhibits provide CE profiles and NSRs for three insurers where detailed property data and reinsurance program information was available • All three insurers had the same Demotech rating of “A” despite the different risk profiles. • The FLOIR stress test includes limited scenarios and is not comprehensive enough to pick up these vulnerabilities. NSR = -2.14 NSR = -7.93 Red bars - 100-year CE event Orange bars - 50-year CE event Blue bars - 20-year CE event
Macro Analysis – Impact of Florida’s Public Risk Financing Entities (Citizens) • Citizens Property Insurance Corporation • NSRs were among the highest for all Florida Insurers • Coastal Account, NSR = 0.71 • PLA/CLA, NSR = 0.73 NSR = 0.73 NSR = 0.71
Macro Analysis – Impact of Florida’s Public Risk Financing Entities (FHCF) • Coverage & Retention calculated for each participating company (based on 2017-2018 FHCF Reimbursement Contract Year). • Coverage = Payout Multiple (14.9294) X Insurer FHCF Premium • Retention = Retention Multiple (based on coverage % selected) X Insurer FHCF Premium • For the FHCF’s statutory limit of $17 billion to be exhausted, all participating insurers would need to exhaust their individual limits – this is highly unlikely to occur. • Probabilities in the FHCF’s upper limit of coverage is low and; therefore, the cost of risk transfer should reflect these lower probabilities. • The methodology is an improvement over the “crude” methodology used for pricing FHCF reinsurance coverage.
FHCF CE Profile $17 Billion $12 Billion $9 Billion *State Farm Florida Insurance Company data was excluded. However, if included and assuming that its limit was exhausted for every event (exaggerated assumption), the 500-year PML would increase to $16.03 billion & AAL to $.95 billion.
Macro Analysis – Impact of Florida’s Public Risk Financing Entities (FIGA) • Results from micro analysis of individual insurers was leveraged to estimate impacts for FIGA • Assumed that insurers were insolvent if insurer losses exceeded its risk transfer program • An insurer’s unpaid losses are passed to FIGA (subject to limits) and is calculated as follows: Where: n = number of insurers insolvent for each event • Results indicate a loss between $50 and $70 billion, 20 insurers could become insolvent
Macro Analysis – Impact of Florida’s Public Risk Financing Entities (FIGA), cont. • FIGA’s biggest exposure is in the Miami area. • Insurer’s event losses can exceed its risk transfer programs by several multiples. • In extreme cases FIGA’s debt obligations could exceed $40 billion. • Some 50-year events could obligate FIGA to over $14 billion in debt. • To put these numbers in perspective • The total of all of FIGA’s net assessments since inception has been $2.3 billion. • The total of all U.S. guarantee fund net assessments since inception have totaled $17 billion. • FIGA is limited in its ability to issue debt to fund insolvencies and could also face constraints due to potential volatility in the financial markets.
FIGA Debt Profile FIGA is highly vulnerable in the tri-county area $40 Billion ($billions) $14 Billion
Macro Analysis – Impact of Florida’s Public Risk Financing Entities (Citizens) • Assumption that policies from insolvent companies will be transferred to Citizens • Citizens policy count for both accounts as of 12/31/17 was 434,919. • As of 12/31/17, the total state-wide policy count was 6,565,783. • Potentially, Citizens could end up writing 2/3 of all policies in the state. Policies to Citizens from Insurer Insolvencies 4 million policies 2 million policies Citizens previous record 1.4 million policies
Summary • Florida is vulnerable to hurricanes, not just extreme hurricanes, but hurricanes similar to those that have occurred in the past and are likely to occur in the future. • It is only a matter of time before an event in excess of $25 or $50B impacts Florida • The authors conducted a two-part study • Micro, 62 Florida Domestic Insurers • Macro, the impact on Citizens, the FHCF, and FIGA • Micro level results show that individual insurance companies are exposed to significantly more risk than is currently identified in current ratings and stress tests • Macro level results show that Florida market could be severely stressed from significant events in the Tampa and Tri-county regions • Results highlight Florida’s vulnerabilities and illustrate how greater insight regarding hurricane exposure and reinsurance protection could strengthen Florida’s residential property insurance system.
Key Findings • NSR is an enhanced approach to quantify an insurer’s risk • The traditional PML based methods have several issues including one number approach, potential for model shopping, variability from year to year, subjective/judgmental changes can impact models, not useful for comparing insurers. • The CE Methodology uniquely applies a comprehensive spatial distribution of events that addresses limitations of the PML approach and provides more complete information on potential vulnerabilities at a micro and macro level • Rating Agency and Regulator approach for quantifying insurers’ exposure to hurricane risk is not sufficiently comprehensive to differentiate insurers or to identify systemic threats • Some Florida Domestics are highly vulnerable to hurricanes. • Florida’s Public Risk Financing Entities • Citizens • One of the most financially secure insurers with NSR of .73 for PLA/CLA and .71 for Coastal Account. • However, insolvencies from a 100-year event could re-populate Citizens by over 4 million policies, numerous 50-year hurricane events could re-populate Citizens to its record $1.4 million policies or greater. • FHCF is unlikely to exhaust its $17 billion current limit since a 500-year event would only be expected to exhaust $15-$16 billion at the most. • FIGA is vulnerable to hurricane events over $25 billion. • A $50-$75 billion event could result in an average of 20 insurer insolvencies (2X the insolvencies from Hurricane Andrew). • A hurricane event over $100 billion could result in an average of 48 insurer insolvencies. • Certain 100-year events could obligate FIGA to over $40 billion far exceeding its ability to finance policyholder losses.