Download
1 / 29
290 likes | 347 Views
This publication details the processing and interpretation of a high-resolution aeromagnetic survey conducted over the Central Edwards Aquifer in Texas. The survey revealed diverse shallow and deep sources, including cultural noise such as pipelines. Tasks included mapping, source separation by depth, and modeling of source geometries. The findings shed light on basement structure, fault intersections, intrusive bodies, and volcanic features influencing groundwater flow paths and water quality. The absence of discernible dikes as barriers to flow was noted. The comprehensive study provides insights for future geophysical surveys and model refinements.

E N D
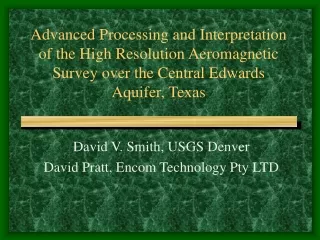
Advanced Processing and Interpretation of the High Resolution Aeromagnetic Survey over the Central Edwards Aquifer, Texas David V. Smith, USGS Denver David Pratt, Encom Technology Pty LTD
Index Map Aeromag survey boundary shown in red
Airborne Magnetic Map (2001 Survey) The total field map reveals numerous shallow (small scale) sources and a few deep (large scale) sources, with cultural noise (pipelines).
Mapping Tasks • Display total magnetic field over entire area. • Separate sources according to depth using a matched-filtering technique. • Overlay shallow sources on existing geologic map.
Potential Field Tilt Image Note the clear separation of deep and shallow sources.
Matched-filtering in a Nutshell • Magnetic fields from isolated bodies drop off rapidly with distance. The mathematics are well understood. • Shallow bodies give strong and locally concentrated anomalies. • Deeper bodies give weak and spread-out anomalies. • Matched-filters are designed to separate sources by depth according to anomaly strength and spatial extent. Some assumptions about source geometries (sphere, cylinder, layer) have to be made for the best separation.
Deep (3000-13000 m) Sources Deep basement rocks appear north of the Balcones fault zone. Thicker sedimentary layers occur south of the fault zone. Two deep igneous intrusive bodies can be seen in the south.
Moderate Depth (500-3000 m) Sources Numerous igneous sources continue to moderate depth, especially isolated pipes in southern Uvalde county.
Shallow (0-500 m) Sources Swarms of small pipes populate southern Uvalde county, with a few isolated pipes to the north and in Medina county. A line of large pipes trends northeast from easting 440.Note scattered cultural noise.
Shallow Sources on a Gradient Residual Map Igneous bodies pipelines Hwy 471 Hondo Hwy 90 Cultural and system noise stands out in grayscale image of the magnetic gradient residual map. Igneous sources (red) are identified by their spatial extent. The meandering feature in the southeast has not yet been classified.
Shallow Sources Extracted Discrete shallow anomalies were extracted and given a red fill. Small ones were checked against aerial photographs to rule out cultural noise, especially in Medina county.
Shallow Sources on Geologic Map Shallow sources are registered on an existing geologic map of the area. Note the close agreement with mapped outcrops.
High Resolution Aeromag Survey Where are the major faults? Area of HEM Survey 2002
North Seco Creek Geology HEM SURVEY BOUNDARY Woodard Cave Fault CATCHMENT AREA Valdina Farms Fault RECHARGE ZONE Two major faults intersect North Seco Creek CONFINED ZONE
Fixed-Wing Data over Faults Survey was flown at 165 m (500 ft) altitude.
Helicopter Mag Data over Major Faults Survey was flown at 30 m (100 ft) altitude.
Modeling Tasks • Define basement structure • Estimate depth to sources • Model 3D source geometries • Encom software packages used: • QuickMag Pro • ModelVision Pro • Profile Analyst
Model Control Sections Five control sections were specified, each passing through major features. Models were developed in ModelVision to match the data along these lines.
Extended Models From the preliminary interpretations along the sections, models were extended to match the 2D spatial distribution. Lines are modeled faults. Purple is deep, red is moderate, brown is moderate/shallow.
3D View of Deep Sources Horizontal gray mesh denotes 15000 m depth.
Shallow Pipes Intrusion depth185 metres 57 discrete anomalies (in black) were chosen for QuickMag modeling. The one in the southwest proved larger and deeper than the others.
Models with Geology Draped on Terrain Visualize modeled pipes versus mapped geology.
Are there any dikes? • Dikes could be major barriers to water flow. • Dikes > 1 m are significant targets. • None were discerned from filtered images. • What is the minimum detectable thickness?
+1 nT -1 nT Intrusive pipes Dike Detection Limits2 km High Pass Filter of Line 580
Conclusions • Clear separation of deep and shallow sources confirm view of intrusives as vertical pipes with deep sources. • High areal density of volcanic features -- not all pipes. While dense clusters of pipes would affect hydraulic regime, isolated pipes likely have marginal affect on regional flow. • Remnant volcanic domes and secondary flows likely influence shallow flowpaths and water quality. • Dikes, as possible barriers to ground water flow, are absent. • Major faults in the Edwards limestone can not be detected with fixed-wing survey, but are discernable in helicopter survey. • Reasonable models were obtained in a short time using automated software.
Future Work • Continued modeling of magnetic data • Further geophysical surveys are planned on the meandering feature in the southeast of the survey area.
References • Smith, D.V., Smith, B.D., and Hill, P.L.,AeromagneticSurvey of Medina and Uvalde Counties, Texas: A Web Site for Distribution of Data, Open-File Report 02-0049, USGS, 2002 • Smith, B.D., et al., Preliminary Results, Helicopter Electromagnetic and Magnetic Survey of the Seco Creek Area, Medina and Uvalde Counties, Texas, SAGEEP2003 • Grauch, V.J.S., and Johnston, C.A., Gradient window method: A simple way to separate regional from local horizontal gradients in gridded potential field data: 2002 Technical Program Expanded Abstracts, 72nd Annual Meeting, Society of Exploration Geophysicists, Paper GM 2.6, CD-ROM • Maclay, R.W., 1995, Geology and Hydrology of the Edwards Aquifer in the San Antonio Area, Texas, Water-Resources Investigations Report 95-4186, U.S. Geological Survey, 2002