Integrating Earth Observation for Crop Damage Alerts
420 likes | 438 Views
Implementing a comprehensive system combining Earth Observation data with meteorological information to monitor climate hazards and assess agricultural impact. The system generates alerts and maps for users to compensate affected farmers with accuracy and efficiency.

Integrating Earth Observation for Crop Damage Alerts
E N D
Presentation Transcript
WMO / COST 718 Expert Meeting on Weather, Climate and Farmers 15-18 November 2004 Geneva, Switzerland
Combining Earth Observation Data into a Crop Meteorological Damage Alert System (Calamities Information System)
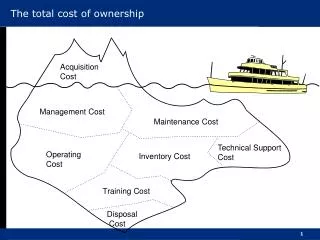
Calamities Information System • An integrated system for the observation of climate hazard phenomena in agriculture through the Internet • A data combination model to estimate the crop damage and the farmers compensation
outline • The goal is to monitor vegetation condition and to evaluate the impact of climate hazards on the environment and agriculture production. • The System combines Earth Observation data with low resolution information in a ready-to-use form. • The system alerts the users, e.g. insurance companies, to crop damage and aids them to compensate farmers who have suffered. • Night frost in early spring, late spring/summer drought and heat excess are the calamities which the System addresses.
outline • The impact of climate hazards on vegetation condition and subsequent damage is assessed using meteorological and Earth Observation satellite data, as well as complementary information such as agricultural statistics, land use maps, tables of phenological stage by region and ground data measurements. • Many types of data, e.g. stratification maps, administrative boundaries and risk maps per type of crop, are used and supplied depending on the calamity concerned. • In the case of frost and drought, data from a meteorological network are used to aid in the interpretation of satellite imagery. • The methodology is adapted to each climate hazard separately.
outline • The main scheme can be described as follows: • Under normal conditions, a monitoring system runs and systematically generates synoptic trends. • The monitoring system activates the alert system whenever risk factors are detected. • The alert system automatically produces temperature maps of critical geographic areas, maps of high risk areas, maps of potential damages indication, maps of minimum and maximum temperatures, maps of drought index calculation, etc. These products are generated by a processing chain and are put at disposal of the end-users. The end-users consult these products using an on-line server.
METHODOLOGY Land Cover Meteorological data Biological stages... MULTISCOPE High resolution images Meteorological satellites DATA PROCESSING AND ANALYSIS Ground temperature map ON LINE INTERNET SERVER Vegetation Index evolutions
Technical architecture CALIS data users Dissemination server Data processing tools Internet network EO, non EO and in-situ data
ON LINE INTERNET SERVER Key deliverables FROST : Basic maps of nightly temperature Maps of Min T° within a given period Maps of sensitive areas Maps with boundaries of Potential damages Comparison between CALIS results and Expertise results DROUGHT, HEAT-EXCESS
CALIS data Land Cover data Daily AVHRR data Hourly temperature measurements from ground meteorological stations
CALIS data Archive Ts and NDVI derived from AVHRR data Archive meteorological data (rainfall) Crop calendars Crop resistance to the risk Agro-meteorological regions limits
CALIS Server Products High Temperatures Frequency VCI TCI RCI Drought Index Minimum Temperatures Distribution Risk Area and Impact Assessment