Download

1 / 14
140 likes | 155 Views
Fractals in Finance and Risk. By: Will Brennan. Why does it matter?. Finance played a crucial role in the development of fractal theory Fractals are used in finance to make predictions as to the risk involved for particular stocks. The Current Model.

E N D
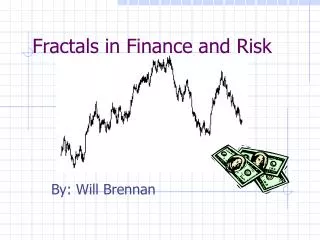
Fractals in Finance and Risk By: Will Brennan
Why does it matter? • Finance played a crucial role in the development of fractal theory • Fractals are used in finance to make predictions as to the risk involved for particular stocks.
The Current Model • Brownian Motion discovered by Louis Bachalier in 1900 (Theorie de la speculation). • Theory was later developed by Albert Einstein, Jean Perrin, and Norbert Weiner
Brownian Motion • http://classes.yale.edu/Fractals/RandFrac/Brownian/Brownian3.html • The Mathematical formula behind Brownian Motion: • |dYi| = (dti)1/2
Brownian Motion and Stock • A graph of IBM stock vs. a graph of Brownian Motion. • When stocks are graphed price vs. time, and thus look similar to Brownian Motion
A Problem Emerges…. • However, when the graph is plotted by successive prices, differences emerge between stock and Brownian Motion.
An Alternate Method? • While the Brownian Motion model can be adjusted to fit observed data, the BM model is not useful in predicting data. • Another method is based on the observation that stocks are statistically self-scaling. The method is to input a simple algorithm that provides the same scaling, and then observe how many features follow automatically.
Cartoons aren’t just for kids • Because this method is designed with no thought to the mechanics of the stock market, it is called a cartoon. • Begins with an initiator and continues with a generator
dt1 = 4/9 - 0 = 4/9, dY1 = 2/3 - 0 = 2/3, so dY1 = (dt1)1/2 dt2 = 5/9 - 4/9 = 1/9, dY2 = 1/3 - 2/3 = -1/3, so -dY2 = (dt2)1/2 dt3 = 1 - 5/9 = 4/9, dY3 = 1 - 1/3 = 2/3, so dY3 = (dt3)1/2 Step 1:Initiator and Generator All 3 segments of the Cartoon Satisfy the condition |dYi| = (dti)1/2
Step 3: Randomize • In order to make more realistic, introduce randomness in the direction of the linear segments
Money mimics Cartoons • When this new cartoon is placed alongside financial data, they are very similar in terms of large jumps and correlation.
Conclusion • Through utilizing a cartoon, a sufficient fractal model is able to make up for the failings of the Brownian Motion model, allowing for investors to predict financial risk.