Download
1 / 13
130 likes | 195 Views
Explore the distinction between exponential and power relationships in regression analysis. Discover how to distinguish linear, exponential, and power relationships using correlation coefficient, log transformations, and log-linear and log-log graphs. Learn key insights for identifying these relationships visually and utilizing semi-log and log-log plots for analysis.

E N D
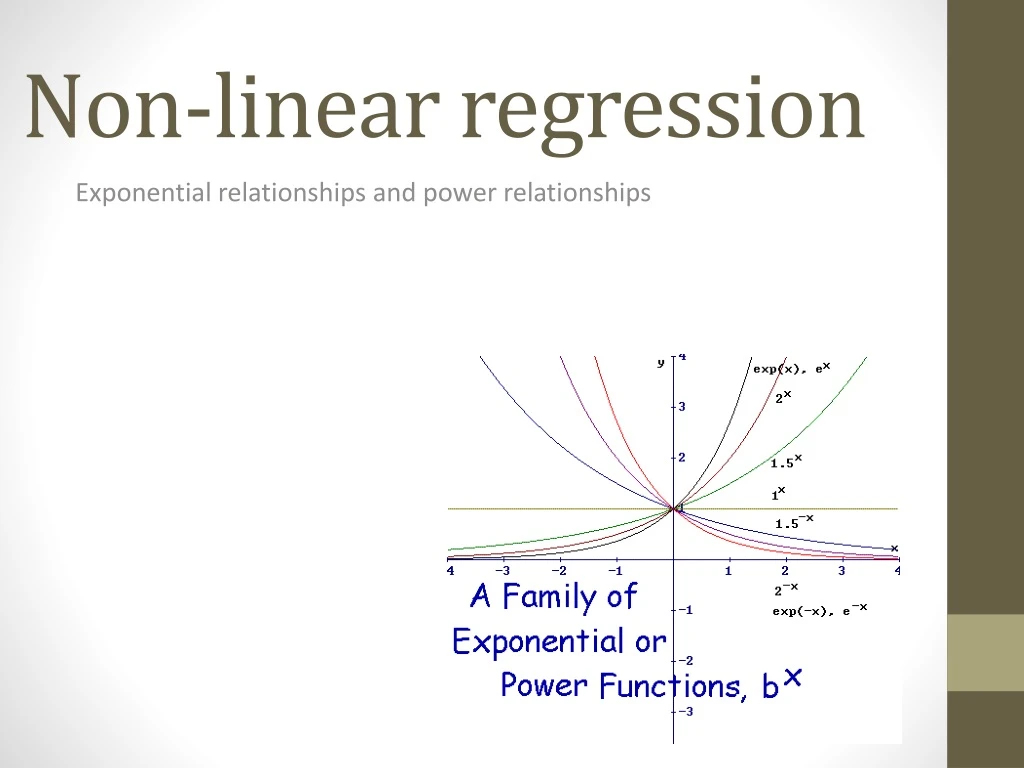
Non-linear regression Exponential relationships and power relationships
Natural log of y If x and ln(y) are linear, then x and y have an exponential relationship -> y=a*bx
Log-linear graph (or semi-log) We scaled the y-axis (logarithmic scale). On the previous slide scaled the values of y (the result is the same). --here we used log10 scale, but it doesn’t matter!
Does this look linear? r=0.963
Does this look exponential? Log-linear graph Log-linear (log10) graph is NOT linear. So x and y do NOT have an exponential relationship!!
ln x by ln y If ln(x) and ln(y) are linear, then x and y have an power relationship. y=a*x^b
Log-log graph Here we scaled both the x-axis and the y-axis (both on logarithmic scales). In the previous slide we scaled the values of x and y (result is the same).
Conclusions • Humans are good at identifying linear relationships visually. • Distinguishing between exponential and power (or other) is very difficult just by looking at data. • So if in doubt, try the semi-log plot and log-log plot to see if either of them are linear.