Download
1 / 37
370 likes | 388 Views
Explore the impact of exclusionary zoning on housing trends through the lens of fair housing in Arlington, MA. Learn how zoning regulations have influenced the demographics and development in the area.

E N D
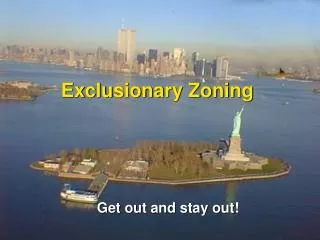
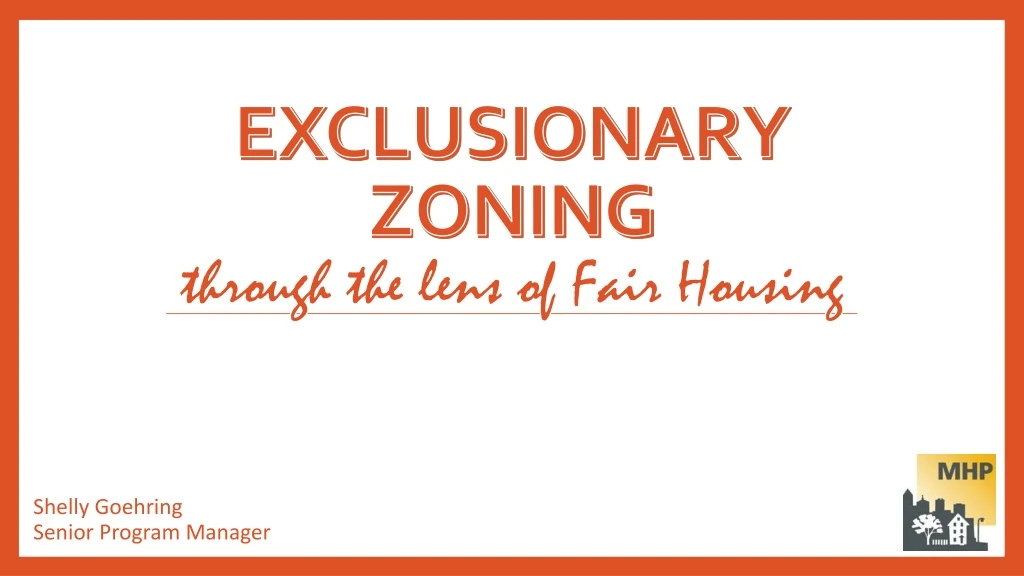
Exclusionary Zoningthrough the lens of Fair Housing Shelly GoehringSenior Program Manager
1884 Arlington, MA
1938Arlington, MA Home Owners’ Loan Corporation
Arlington district C-2Why is it “declining?” • Area Characteristics • Detrimental Influences: “Obsolescence. Business and housing mixed together. Railroad tracks through neighborhood.” • Trend of desirability next 10-15 years = DOWN • Inhabitants • Occupation: clerks –labor • Estimated annual family income: $1,500-2,500 • Foreign-born families: Italian • Infiltration of: Lower class • Clarifying RemarksLittle possibility of conversion of properties to business use.
Arlington’s First Zoning Map - 1924 Yet Arlington remained largely “pro-growth.” 1945 – district to allow four stories or 60’ height(10+ more created, largely in NE & 7 blocks along Pleasant) Von Hoffman, Alexander. “Creating an Anti-Growth Regulatory Regime: A Case from Greater Boston.” Joint Center for Housing Studies, Harvard University. Feb. 2006.
Arlington Single Family Attached HomesSunnyside Avenue, Two-Family zoning district Built in 1948 andsold for $6,250 $6,250 = $65,366 in today’s dollars Source: Town of Arlington,Bureau of Labor Statistics
2015 Arlington, MA Zoning Map
Conservation and Historic Movements 1960s and 1970s • 1966 – Arlington Conservation Commission Enabled by state legislation – protect and develop the town’s natural resources, conduct research, draw plans and recommend actions • 1970 – Arlington Historical Commission Purpose to preserve & protect historic buildings, discourage demolition, advise town building inspector Von Hoffman, Alexander. “Creating an Anti-Growth Regulatory Regime: A Case from Greater Boston.” Joint Center for Housing Studies, Harvard University. Feb. 2006.
Arlington created a Redevelopment Board • 1970s as “anti-growth” movement grew • Reversed town’s “pro-growth” policy • Two-year moratorium on multifamily development (154-17 TM vote) • New zoning in 1975 – ↑ lot size, ↓ height, ↑ parking, ↑ zoning districts “Residents should be the ultimate decision makers about how the area they live in should be developed.” Von Hoffman, Alexander. “Creating an Anti-Growth Regulatory Regime: A Case from Greater Boston.” Joint Center for Housing Studies, Harvard University. Feb. 2006.
2015 Arlington, MA Zoning Map
Many only develop in Arlington once. --long-time Arlington real estate lawyer
Weston, MA • ~15 miles from downtown Boston • Three commuter rail stops -- Fitchburg line • Access to 90, 95 and Routes 20, 30 and 117 • Almost 1/5 of land is public forests, conservation land or parks • Much of the private land is woods, meadows and lawns • No public sewer
Hastings Organ Factory Built on farm fields in the Hastings family since the early 19th century. Near the railroad and Stony Brook.
Resident Leadership Changed • 1820sSummer residents and gentlemen farmers move in. By late 1880s, began separating from others. • 1890+Began suppressing industry to protect scenery. • 1954New zoning designed to curb growth by increasing lot size. Remaining developable land put in Residential Class A (minimum 60,000 square feet).Second growth control measure, increased buying conservation land. • 1955-75Adds 1,300 acres of open space to the 50 acres owned in 1945.Almost 12% of Weston’s total area. www.westonhistory.org and “To Preserve and Protect: Land Use Regulations in Weston, MA” by Alexander von Hoffman.
Weston Minimum lot sizes Dark Green = 20,000 square ft(0.46 acre) Bright Green = 30,000 square ft(0.69 acre) Light Green = 40,000 square ft(0.91 acre) White = 60,000 square feet(1.37 acres)
Weston Compared to Neighbors Boston 14,387
By 2010 in Massachusetts 2010 Census
Exclusionary Zoning Use of zoning ordinances to exclude certain types of land uses from a given community. What it looks like: • Large minimum lot sizes • Only one home per lot • Low income housing only in currently low income (or less affluent) neighborhoods
Large lot zoning drives up costs. Greater Bostonmedianlot size: Greater Bostonaverage lot size:
These unlawful practices include zoning laws and other housing restrictions that function unfairly to exclude minorities from certain neighborhoods without any sufficient justification. Suits targeting such practices reside at the heartland of disparate-impact liability. --Justice Kennedy, Texas Department of Housing and Community Affairs v. Inclusive Communities Project, Inc. (5-4 decision)
“Class” is not a protected class under the Fair Housing Act Federal (Fair Housing Act) • Race • Color • National Origin • Religion • Sex • Familial Status • Disability State (M.G.L. c. 151B) All federal bases plus: • Ancestry • Age • Marital Status • Source of Income/Public Assistance • Sexual Orientation • Gender Identity • Veteran History/ Military Status • Genetic Information
But class has racial implications.
Racial Wealth Gap Homeownership contributes 27% to racial wealth gap (Single biggest share) Difference in income contributes 20% to racial wealth gap Brandeis Institute on Assets & Social Policy, “The Roots of the Widening Racial Wealth Gap: Explaining the Black-White Economic Divide,” 2013.
Massachusetts HomeownershipRacial gap = 49thin nation www.scorecard.prosperitynow.org/2016
The Consequences are REAL • Takes 8 more years for A-A household to buy • Lower incomes and less inheritance • Slower to accumulate equity • More wealth in home • 53% Black vs 39% White • Greater impact from housing market volatility Brandeis Institute on Assets & Social Policy, “The Roots of the Widening Racial Wealth Gap: Explaining the Black-White Economic Divide,” 2013.
A Look at Net Worth Brandeis Institute on Assets & Social Policy, “The Roots of the Widening Racial Wealth Gap: Explaining the Black-White Economic Divide,” 2013.
The Color of Wealth in BostonFederal Reserve Bank of Boston report
"Massachusetts has a history of being a welcoming community for absolutely everyone. We have a chance to once again clearly and loudly proclaim that everyone is welcome here in Massachusetts.“ -- MA legislator