Download
1 / 13
130 likes | 146 Views
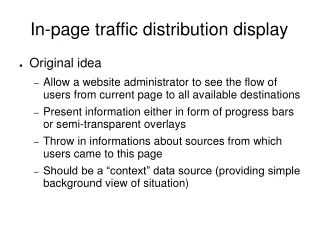
In-page traffic distribution display. Original idea Allow a website administrator to see the flow of users from current page to all available destinations Present information either in form of progress bars or semi-transparent overlays

E N D
In-page traffic distribution display • Original idea • Allow a website administrator to see the flow of users from current page to all available destinations • Present information either in form of progress bars or semi-transparent overlays • Throw in informations about sources from which users came to this page • Should be a “context” data source (providing simple background view of situation)
Evil reality intrudes • Available data somewhat skimpy, and so pageA -> pageB visit statistics are quite meaningless • Largest sources of traffic – unknown, Google • Result: right now, backend offers only global link popularity data • Also, got tangled up with a nasty bug in Opera – had to change target browser in the middle of development
Benefits • Administrator can compare usefulness of links without digging through reports • No modifications of source website needed • No diving into unmaintainable cruft! • Access logs are the only required data source • So simple that even a manager can use and understand it
Building blocks • Client: Firefox with Greasemonkey extension (allows the user to run their own Javascript on pages they visit) • Web Server: just about anything • Statistics Server: Apache with a couple of Python scripts.
Browser Request Web Page Web Server Statistics Server
Browser (link extraction) Web Server Statistics Server
Browser XMLHttpRequest asks for popularity of given URLs Number of visits for every requested URL Web Server Statistics Server (data served by Python script)
Browser (process and display received data) Web Server Statistics Server
Demo • Or static screenshots if statistics server (my home machine) is down for some reason.