Download
1 / 9
90 likes | 112 Views
This research focuses on the relationship between hurricanes and their occurrence. Specifically, it examines the track and consequences of Hurricane Katrina in 2005, along with the areas of New Orleans that were most impacted. The study also explores the correlation between the social vulnerability of certain populations within the city and the effects of the hurricane.

E N D
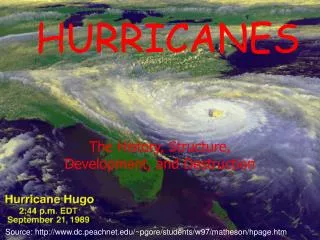
Hurricanes Meredity
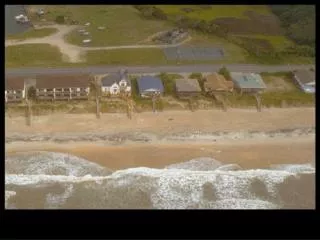
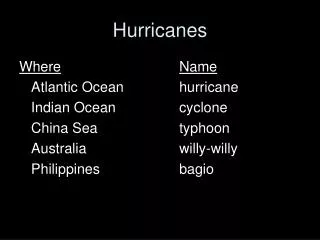
Research Focus • When and where do hurricanes occur and is there a relationship between the two variables? • What track did Hurricane Katrina follow in 2005 and what were the consequences? • What areas of New Orleans were most impacted by Hurricane Katrina? How does that relate to the social vulnerability of certain populations within the city?
Context: • These are interesting questions because… • Allows for consideration of science in-conjunction with a societal impact/issue (social justice). I.e. human/environment interaction. • Data on simple variables naturally lead to the larger interaction between variables – leading to a more complex conceptual framework of the concept.
Method • What data was collected; best data to answer your question? • Hurricane tracking data • Using the Hurricane Portal, the student can access data from Hurricane Katrina (ie pressure vs wind) • Maps of New Orleans and flooding vs socioeconomic status. • Data examination might include: • Create maps to track hurricane movement • Create graphs to make comparisons of weather variables during hurricane conditions. • Overlay maps to determine if a pattern exists between flooding and socioeconomic status. (see http://gos2.geodata.gov/wps/portal/gos for census track map data for students to use when creating their own maps)
Data Summary: http://www.teachersfirst.com/resources/track_chart.gif http://www.emforum.org/vforum/lc070613.htm
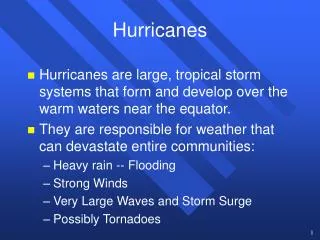
Data Summary • Hurricane patterns: students should find that hurricanes occur during a ‘season’; warm water temps and optimal conditions for pressure differences. • Example tracking map from 2005: http://www.wunderground.com/hurricane/at2005.asp
Data Summary http://www.ncdc.noaa.gov/img/climate/research/2005/katrina/katrina-prcp-anal.png
Conclusion • Hurricanes are a natural hazard occurring in specific locations under specific conditions that impact life. (see http://www.ncdc.noaa.gov/oa/climate/research/2005/katrina.html#top for specific impacts from Katrina) • Assessment may include opportunities for both formative and summative: • Formative- pre and post concept map • Summative- score tracking map; score (using a rubric) an essay on human/environment interactions; include a map or graph/data interpretation question on an exam.
Implications • Need to add specific data analysis of ocean water temperature and pressure…. • Need to add some ‘transparency’ of the inquiry teaching process if using this in a methods course.