Download
1 / 29
290 likes | 310 Views
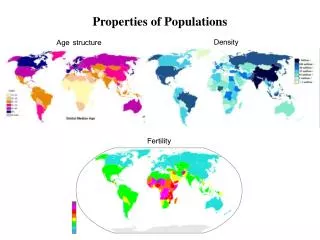
Learn about habitat, species, population size and density, types of dispersion, sampling techniques, equations, and examples in population studies.

E N D
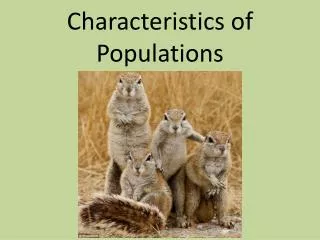
Characteristics of Populations Chapter 11.1 McGraw-Hill Ryerson Biology 12 (2011)
CHARACTERISTICS of POPULATIONS • Habitat: the place where an organism lives • Species: organisms that resemble one another in appearance, behaviour, chemistry and genetic makeup and that have the ability to interbreed with each other under natural conditions (produce viable offspring).
Population Size (N): the number of individuals of a species occupying a given area at a given time (ex. 700 Wood ducks in Elevator Bay).
POPULATION DENSITY • Population Density (D) is calculated by dividing the population size or number of individuals (N) by the space occupied by that population (S). D = N S
Usually smaller organisms have much greater population densities than larger organisms. (Ex. 350 field mice per hectare in Algonquin Park vs. 0.8 moose per hectare)
TYPES of DENSITY • Crude Density: number of individuals of the same species per total unit area or volume. • Ecological Density: number of individuals of the same species per useable unit area or volume. D = N S or useable S
Density Sample Questions • A backyard measuring 3.0 m by 4.0 m contains 215 dandelions. Determine the population density of the plants. • A small field having an area of 1.5 ha contains a pond with a surface area of 0.3 ha and is home to 300 field mice. Calculate their ecological density. • Researchers want to relocate some nuisance black bears into a forest in Northern Quebec that is 750 km2. If each bear requires 40 km2 of forest to live successfully, how many bears can be successfully relocated here?
POPULATION DISPERSION • Population Dispersion is the pattern inwhich individuals are dispersed throughout a specific area. There are 3 general types:
POPULATION DISPERSION • Clumped Dispersion: organisms are densely populated in areas of the habitat with favourable conditions for survival, usually around resources (most populations exhibit this...cattails growing at the edges of ponds, fishswimming in schools...)
POPULATION DISPERSION continued... • Uniform Dispersion: individuals are evenly distributed throughout the habitat. Occurs when individuals set up territories (ie Penguins).
POPULATION DISPERSION continued... • Random Dispersion: occurs when the habitat is particularly uniform and interactions with other members of the same species do not affect distribution. This is fairly rare in nature, ex.: some tropical trees.
SAMPLING TECHNIQUES • It is rare that biologists can take an exact count of all the members in a population due to the size and/or range over which the population lives. • Instead biologists count a sample of the population and estimate the population size from this sample.
QUADRAT SAMPLING • A common sampling technique for stationary populations is quadrat sampling. • A quadrat, or sampling frame, is placed in a region within the habitat and each member of the population of the species in question that appears in the frame is counted.
The more quadrats used the more accurate the population density and population size measurements.
Equations • Average sample density = total number of individuals counted in sample/ total sample area • Estimated population size = average sample density X total size of study area. ASD = sample N sample Area Estimated Pop size = ASD x total area
Quadrat Study Example • Scientists are studying the distribution of Trilliums in a section of Lemoine Point covering 100m by 100m. They place four 1.0m X 1.0m quadrats randomly in this area and count the number of trilliums in each to be 5, 2, 1 and 3. • What is the estimated trillium population density? • What is the estimated trillium population size? • What is one source of error in this method?
MARK-RECAPTURE SAMPLING • A common sampling technique for mobile or dangerous populations is mark-recapture. • Biologists trap/tranquilize/catch a number of individuals of a population, mark them and then release them back into their habitat. • A short time later they catch a second sample of the population and use the ratio of the marked recaptures to the unmarked captures to estimate the population size.
The marking must not : • harm the individual, • prevent it from going about daily activities or • make it more easily caught a second time.
MARK-RECAPTURE formula • Total # marked (M) = # of recaptures (m) population size (N) 2nd sample size (n) • Rearrange to solve for population size N = Mn m M = m N n Solving for
The accuracy of the mark-recapture method depends on certain assumptions: • every organism in the population has an equal chance of being captured, • during the time between captures the proportion of marked to unmarked remains unchanged, • and, the population size does not increase or decrease during the sampling study.
Mark-Recapture Example • On day one, 20 warblers are captured in mist nets. The birds are then marked with leg bands and released. One week later, the nets are reset and 50 warblers are captured. Of these 50, 10 of them were banded from the week before. Estimate the warbler population size.
Fecundity/Biotic Potential: potential number of offspring that can be produced. • eg HIGH – starfish, 1 million eggs/year • LOW – hippo, 20 births in 45 years • Fertility: actual number of offspring produced
SURVIVORSHIP CURVES • General patterns in the survivorship of species
Type I • Species have a low mortality rate when young • These are slow to reach sexual maturity and produce small numbers of offspring. • Have a longer life expectancy. • Ex: Large mammals, including humans
Type 2 • Intermediate between types I and III • Have a uniform risk of mortality over their lifetime. • Certain lizards, perching birds, rodents.
Type 3 • Very high mortality rate when young • Those that reach sexual maturity have a greatly reduced mortality rate • Very low average life expectancy (ex. Green Sea Turtle).
ETHICS • The Canadian Council on Animal Care (CCAC) had developed ethical guidelines for wildlife research. They stress the three R's: • Reduce the use of animals in their study as much as possible. • Refine your techniques to minimize discomfort and stress on the animal • Replace live-trapping with computer modelling whenever possible. www.ccac.ca
Homework • Pg 508 #2, 3, 5, 6, 8,