Download
1 / 17
170 likes | 191 Views
Learn about the effects of ozone and fine particulates on respiratory health in New England. Explore data on childhood asthma and pulmonary function monitoring in the region.

E N D
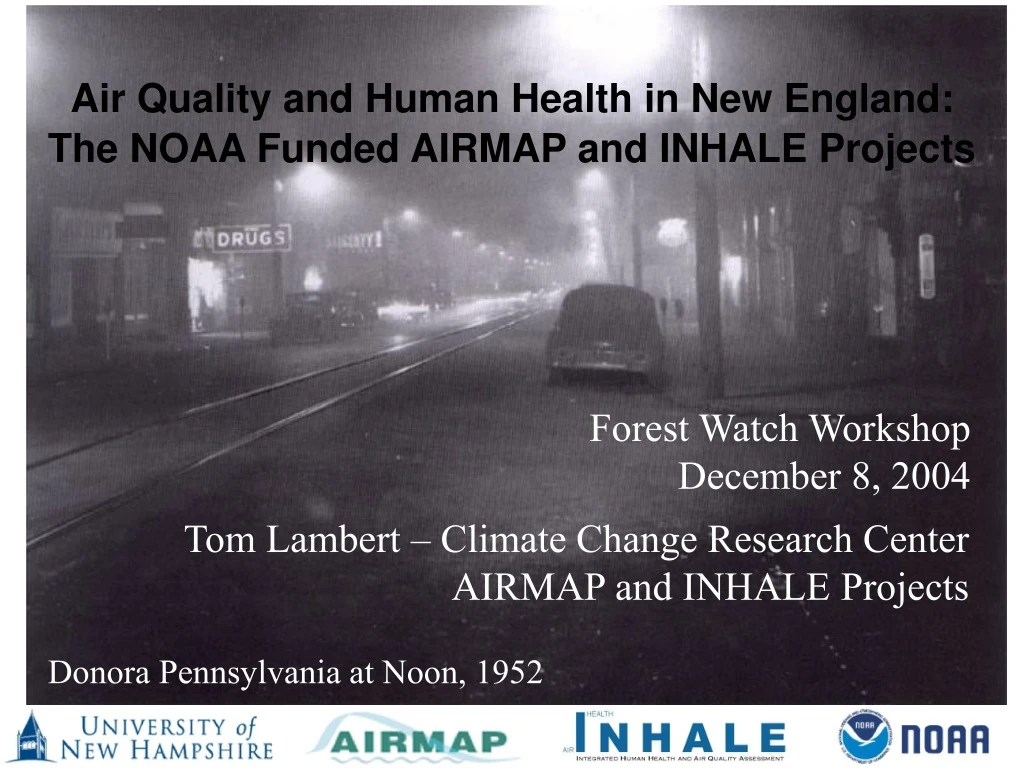
Air Quality and Human Health in New England: The NOAA Funded AIRMAP and INHALE Projects Forest Watch Workshop December 8, 2004 Tom Lambert – Climate Change Research Center AIRMAP and INHALE Projects Donora Pennsylvania at Noon, 1952
Ozone: Good Up High - Bad Nearby Ground level ozone is formed via a chemical reaction VOCs come primarily from vegetation and industrial sources. NOx comes from automobiles, trucks, buses, and power plants. Ozone pollution is a concern primarily during the summer months when the weather conditions to form it (lots of sun and hot temperatures) normally occur.
Fine Particles (PM2.5) Fine particles have diameters less than 2.5 microns. PM2.5 are composed of dust, dirt, soot, smoke, and liquid droplets. Fine particles are formed by: 1. Direct release (fires, exhaust, dust) 2. Chemical reaction SO2+VOC+NOx+NH3+Water+sunlight = PM2.5
AIRMAP New England lies directly downwind of major urban and industrial centers in the eastern United States. Map of common storm tracks across the United States.
New England is a Hot Spot for Childhood Asthma From New England Asthma Regional Council Report: Asthma In New England (2001 data)
Asthma in exercising children exposed to ozone: a cohort study Rob McConnell et al., 2002, THE LANCET vol. 359 3535 children 12 communites 5 years Low ozone max 1 hr median: 48 ppb High ozone max 1 hr median: 74 ppb
“Tip of the Iceberg” Adverse health effects that could be avoided every year by meeting the US EPA's daily maximum ozone standard (80 ppb 8-hr) in New York. Figure sections not drawn to scale. From Thurston 1997.
INHALE - Summer 2004 Pulmonary Function Monitoring Spirometry Twice daily Respiratory Symptoms Once daily
Over 20,000 Observations with 450 People in New England Peak Flow
Preliminary Observations • Pulmonary function responds over different time scales • Seasonally • Daily • Within the day • Over weeks
First Second Volume (liters) DES/DHHS Retirement Community
Standardized 6-Second Volume (liters) DES/DHHS Retirement Community
6-Second Volume DES/DHHS Retirement Community
Ozone – 8 hour Maximum Ozone ppbv First Second Volume DES/DHHS
Fine Particulates µg/m3 Retirement FEV6 (liters) DES/DHHS FEV6 (liters)
Continuing Work • Build models to explain variability in pulmonary function • Short term variability • Seasonal variability • Additionally • How are allergens and respiratory symptoms affecting pulmonary function? • Are pollutants acting “together” to create a more toxic effect?


