Download
1 / 20
200 likes | 303 Views
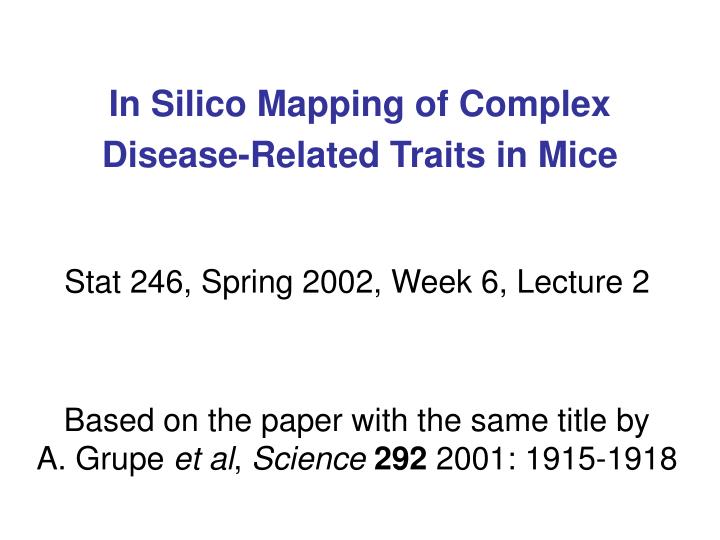
In Silico Mapping of Complex Disease-Related Traits in Mice. Stat 246, Spring 2002, Week 6, Lecture 2 Based on the paper with the same title by A. Grupe et al , Science 292 2001: 1915-1918. Crosses of inbred strains of mice. Here the grey scale denotes a quantitative trait.

E N D
In Silico Mapping of Complex Disease-Related Traits in Mice Stat 246, Spring 2002, Week 6, Lecture 2 Based on the paper with the same title by A. Grupe et al, Science292 2001:1915-1918
Crosses of inbred strains of mice Here the grey scale denotes a quantitative trait.
Mapping genes for complex traits in crosses of inbred mouse strains I will refer you to the notes from Weeks 3 and 4 of my Stat 260, Spring 1998. There I describe mouse crosses and and linkage mapping methods for analyzing genome scans for localizing quantitative trait loci (genes) to regions of chromosomes. We take up the problem from there. The next step is quite time-consuming, and usually involve creating so-called congenic strains, which can take 1-2 years. After this still more time-consuming work is required: physical mapping and genomic sequencing. Of course you could get lucky sequencing candidate genes, but this cannot be relied upon. We now consider alternatives: in silico and microarrays.
1 2 3 4 19 ... Strain 2 Chromosome 4 Congenic Strain 1 2 3 4 19 ... Strain 1 Achieved by repeated backcrossing following selection for the region to be retained.
Single Nucleotide Polymorphisms: An Introduction • “Some people have blue eyes, some are great artists or athletes, and others are afflicted with a major disease before they are old. Many of these kinds of differences among people have a genetic basis--alterations in the DNA that change the way important proteins are made. Sometimes the alterations involve a single base pair (the smallest building block of DNA) and are shared by many people. Such single base pair differences are called "single nucleotide polymorphisms", or SNPs for short. Nonetheless many SNPs, perhaps the majority, do not produce physical changes in people with affected DNA. • Why then are genetic scientists eager to identify as many SNPs as they can, distributed on all 23 human chromosomes? Two reasons: Even SNPs that do not themselves change protein expression and cause disease may be close on the chromosome to deleterious mutations.Because of this proximity, SNPs may be shared among groups of people with harmful but unknown mutations and serve as markers for them. Such markers help unearth the mutations and accelerate efforts to find therapeutic drugs. Analyzing shifts in SNPs among different groups of people will help population geneticists to trace the evolution of the human race down through the millenia and to unravel the connections between widely dispersed ethnic groups and races.” • From http://snp.cshl.org/about/introduction.shtml
http://mouseSNP.roche.com • In a variant on the two reasons for collecting SNPs, we will see how databases of mouse SNPs can help us map complex and quantitative traits in mouse. • The site above is “A web-accessible database …which contains information across 15 inbred strains and specifics genotyping assays for over 500 SNPs at defined locations on the mouse genome. ….The oligonucleotide primer sequences and conditions for performing allele-specific kinetic PCR genotyping assays are also provided….” • We digress to learn a little about the genotyping method, as it is quite similar to so-called Real-Time PCR (RT-PCR), which is an important method of quantifying mRNA. If you don’t know how PCR works, find out: Week 9 of Stat 260, 1998 has some notes on this important technique.
Genotyping SNPs on a large scale is a challenge. • “We have developed an accurate, yet inexpensive and high-throughput, method of determining the allele frequency of biallelic polymorphisms in pools of DNA samples. The assay combines kinetic (real-time quantitative) PCR with allele-specific amplification and requires no post-PCR processing. The relative amounts of each allele in a sample are quantified. This is performed by dividing equal aliquots of the pooled DNA between two separate PCR reactions, each of which contains a primer pair specific to one or the other allelic SNP variant. For pools with equal amounts of the two alleles, the two amplifications should reach a detectable level of fluorescence at the same cycle number. For pools that contain unequal ratios of the two alleles, the difference in cycle number between the two amplification reactions can be used to calculate the relative allele amounts. We demonstrate the accuracy and reliability of the assay on samples with known predetermined SNP allele frequencies from 5% to 95%, including pools of both human and mouse DNAs using eight different SNPs altogether. The accuracy of measuring known allele frequencies is very high, with the strength of correlation between measured and known frequencies having an r2 = 0.997. The loss of sensitivity as a result of measurement error is typically minimal, compared with that due to sampling error alone, for population samples up to 1000. We believe that by providing a means for SNP genotyping up to thousands of samples simultaneously, inexpensively, and reproducibly, this method is a powerful strategy for detecting meaningful polymorphic differences in candidate gene association studies and genome-wide linkage disequilibrium scans.” • Abstract of S. Germer et al, Genome Res. 10258 (2000).
Figure 1 of Germer et al The basis of allele frequency measurement using kinetic PCR. Shown are amplification growth curves of PCR reactions performed for the ApoB71 polymorphism. A sample was constructed from two DNAs each homozygous for the different alleles of the ApoB71 SNP and contains 5% of allele 1. Equal aliquots of the pool (20 ng of DNA each) were put into PCRs containing either of the two allele-specific primer sets. Four replicate reactions were performed with each primer set (eight PCRs total). The relative allele frequency is determined on the basis of the Ct using freq of allele 1 = 1/(2^Ct +1).
Figure 2 of Germer et al The relationship between Ct and allele frequency. The solid center line is a plot of the equation relating freq of allele t to Ct. The flanking solid lines represent the expected uncertainty (1 S.D.) in estimating the allele frequency base on sampling error alone (sample size = 1000). The broken lines represent the combined uncertainty of sampling and measurement error. The measurement error is based on an average error seen amongst the measurements taken in this paper and is that expected after averaging four replicate measurements. The insets compare the impact of measurement error at the middle and at the upper extreme of allele frequencies (the lower extreme should mirror exactly the upper).
A demonstration of the utility of SNPs: Two approaches to gene localization • At 16 weeks of age, the 1000 F2 progeny of a C57BL/6 B6D2 cross displays a non-sex-linked, normal distribution of bone mineral density (BMD). Phenotypically extreme F2 progeny with the highest (n=150) and lowest (n=149) BMD were subjected to whole-genome scanning for association with BMD by genotyping individual DNA samples with 112 microsatellite • In addition equal amounts of DNA from the high and the low BMD progeny was used to form two pools of DNA samples. Allele frequencies in the pooled samples were measured for 109 SNPs found in the database using the allele-specific kinetic PCR method. • Differences in allele frequency between the two extremes for each marker were scored. The significance of each allele-frequency difference was calculated using the z-test and plotted as a lod score, see next Figure. • Exercise. Explain how locus and genome-wide significance can be assigned to allele differences by each method. Which method seems simpler and which seems more precise?
Comparison of SNP-based genotyping of pooled DNA samples with microsatellite genotyping of individual samples. Phenotypically extreme F2 progeny from a B6D2 intercross with the highest and lowest BMD were subjected to whole-genome scanning for association with BMD by genotyping either individual DNA samples (from 299 mice) with 112 microsatellite markers or two pooled DNA samples (150 mice per pool) with 109 SNP markers. The significance of each allele-frequency difference was calculated using the z-test and plotted as a lod score for all chromosomes. Dashed line indicates a lod score of 3.3, the threshold for genome-wide significance.
The in silico approach: no new genotyping • Using allele distributions across inbred strains from the mSNP database, and available phenotypic information, can we map chromosomal regions regulating quantitiative traits? • Idea: calculate genotypic distance between loci for a pair of inbred strains, and compare these with phenotypic differences between the two strains. Repeat for all mouse strain pairs for which the information is available. • In practice Grupe et al calculate upper-triangular phenotypic and genotypic arrays P=(p(i,j)) and G=(g(i,j)), as follows: p(i,j) corresponds to the absolute difference between the phenotypic data for strains i and j, while entries g(i,j) in the upper-triangular matrix G are derived for moving 30 cM regions (10 cM increments) of the mouse genome by counting the number of allelic differences between strains i and j in a region. (Note that at any given SNP locus, any given inbred strain is homozygous.) • The Pearson correlation between the entries in these two arrays is then calculated, and a mean and SD correlation across all intervals is used to convert the correlations to z-scores.
Diagrammatic representation of the computational prediction method. Three pairwise comparisons (A, B, and C) using three mouse strains are shown. The blue and purple strains exhibit a similar phenotype, while the green strain has a different phenotype. SNP alleles at a chromosomal region are represented as orange or yellow ovals. Black boxes indicate genomic regions with a high probability for regulating a trait. Red boxes indicate regions with a low probability. (A) is a comparison between strains with a similar phenotype, whereas (B) and (C) are comparisons between strains with different phenotypes. Most chromosomal regions exhibit a low or negative correlation with phenotypic data. Two chromosomal regions, which have the strongest positive correlation, are predicted to have genes regulating the phenotype.
Computational prediction of chromosomal regions regulating (A) MHC haplotype and (B) airway hyperresponsiveness. The correlation between the genotypic and phenotypic distributions is graphically shown for each trait; segments are arranged from centromeric to telomeric for all 19 autosomes. Each bar represents a 30-cM interval, and neighboring bars are offset by 10 cM. The dotted line represents a useful cutoff for analyzing this data; the most highly correlated 10% of the loci are above this line. Striped bars represent locations of experimentally verified QTLs.
Comments on the Grupe et al method • Firstly, it works! In their paper, the authors discuss 10 phenotypes ranging from alcohol preference to lifespan following lymphoma where experimentally identified QTL intervals can be compared with ones predicted by this computational method. The agreement is good. • Secondly, can you see why it might be expected to work? • Thirdly, can you see how one might go about refining the method?
Why does it work? Linkage disequilibrium • The key concept here is linkage disequilibrium (LD), also know as gametic association. It is a population concept, referring informally to association between alleles at different loci on in a population of chromosomes. • Here is a little story. Suppose that at some time in the past, a person received a new mutant form of a gene on a chromosome, near a locus at which s/he had allele a1 say, out of a set a1 ,a2 …,anof alleles present at that locus in a population. Call the mutant form at the gene m1, and the normal or wild-type form m2. Then on just one chromosome in that population, the haplotypea1 m1can be found. If that chromosome is passed on to descendents of this person, the two alleles a1and m1 will go down together on their segment of the transmitted chromosome, until such time as recombination events separates the a-locus from the gene on the carrier chromosomes. Depending on how close the two loci are, this will occur more or less frequently, and if the two loci are very close together, the haplotype a1 m1may remain in the population a very long time. During this time the frequency of could increase well beyond its original 1/n, where n was the total number of chromosomes in the population, but the alleles at the a-locus may remain associated with those at the gene as a result of the creation by the mutation of this ancestral haplotype.
Why it works, continued. • This little story tells us that mutant alleles in genes and marker alleles may well be associated in populations, and that such associations may persist to an extent that depends on the distance (cM or base pairs) between the loci, and a variety of population genetic factors which we need not enumerate. • Regardless of the plausibility if this story, it is a fact that we do observe associations, sometimes quite strong ones, between the alleles present at nearby loci. This is undoubtedly a result of the fact that chromosomes are passed down from parents to offspring as long segments whose origin alternates between grandparents, thus permitting combinations of alleles at linked loci to remain largely as they were. In general we find that closer loci exhibit stronger association, but exceptions abound, as we would expect by reflecting on our story. Relevant to the distance-association relationship will be the structure, size and temporal behaviour of the population, the age of mutations, the selective nature of mutations at or nearby the locus under consideration, and a number of other factors. Nevertheless, the relationship is valid enough to be useful, as this is why the Grupe et al method works. Each inbred mouse strain is like a person in a population, and the time back to their common ancestors is such that long enough chromosomal segments are shared.