Download
1 / 23
230 likes | 328 Views
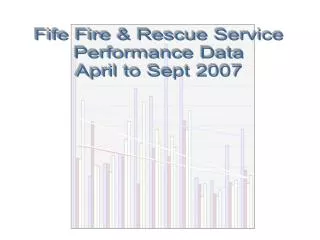
Explore the performance data of Fife Fire & Rescue Service from April to September 2007, comparing against the previous year. Analyze reduction trends, fire casualties, response times, and sickness periods.

E N D
Fife Fire & Rescue Service Performance Data April to Sept 2007
Local Performance Indicators The trend lines throughout the document show the comparison against last years performance
Quarter 1&2 figures show a 22% reduction over the same period last year
Quarter 1&2 figures show a 26.7% reduction over same period last year.
Quarter 1&2 figures show a 16% reduction over same period last year.
Quarter 1&2 figures show a 37% reduction over same period last year.
Quarter 1&2 figures show a 29.5% reduction over same period last year.
Quarter 1&2 figures show a 3.4% reduction over the same period last year
Quarter 1&2 figures show a 18% reduction on same period last year.
Quarter 1&2 figures show a 7.6% reduction over same period last year.
Quarter 1&2 figures show a 9.5% reduction over same period last year.
Quarter 1&2 figures show a 6% reduction over same period last year.
13% of alarms in Quarter 1&2 dwelling fires did not operate for whatever reason (8.6 reduction).
FS 2 - Accidental Dwelling Fires Number of Fires Number Quarterly totals % Total number per quarter (per 10000 population) April 26 0.71 May 23 0.63 June 21 0.57 1.92 70 July 20 0.55 07-08 Target 6.8 August 22 0.60 September 4 0.11 1.26 46 October 0.00 November 0.00 December 0.00 0.00 0 January 0.00 February 0.00 March 0.00 0.00 0 Total for Year 116 3.17 To Date
Quarter 1&2 figures show a 11.5% reduction with a 4 year average 8.23, on track to meet target of 6.8
FS 3 – Call Response Times a) Calls handled within one minute 06-07 Period average 1 min, 65.98% 07-08 Period average 1 min, 61.6% b) Calls handled within two minutes 06-07 Period average 1 min, 97.69% 07-08 Period average 2 min, 96.79%
FS 4 - Sickness Period trend is down for rider shifts, but 74% increase on 4yr average for all other staff
Quarter 1&2 figures show a 43% reduction over same period last year.Period average 4.06%.