Download
1 / 37
370 likes | 516 Views
On the intimate relationship between functional and effective connectivity Karl Friston, Wellcome Centre for Neuroimaging.

E N D
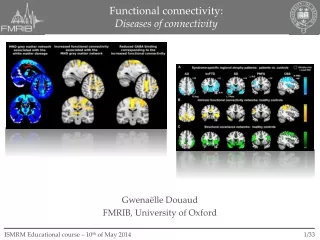
On the intimate relationship between functional and effective connectivity Karl Friston, Wellcome Centre for Neuroimaging The past decade has seen tremendous advances in characterising functional integration in the brain; especially in the resting state community. Much of this progress is set against the backdrop of a key dialectic between functional and effective connectivity. I hope to highlight the intimate relationship between functional and effective connectivity and how one informs the other. My talk will focus on the application of dynamic causal modelling to resting state timeseries or endogenous neuronal activity. I will survey recent (and rapid) developments in modelling distributed neuronal fluctuations (e.g., stochastic, spectral and symmetric DCM for fMRI) – and how this modelling rests upon functional connectivity. This survey concludes by looking at the circumstances under which functional and effective connectivity can be regarded as formally identical. I will try to contextualise these developments in terms of some historical distinctions that have shaped our approaches to connectivity in functional neuroimaging.
Dinner Speaking [edit] The Dinner speech should not resort to the base forms of humor. The humor should be topical and relevant to the idea presented. This type of speech is found at the collegiate level and is typically eight to ten minutes long.
The past decade has seen tremendous advances in characterising functional integration in the brain; especially in the resting state community. Much of this progress is set against the backdrop of a key dialectic between functional and effective connectivity.I hope to highlight the intimate relationship between functional and effective connectivity and how one informs the other. My talk will focus on the application of dynamic causal modelling to resting state timeseries or endogenous neuronal activity. I will survey recent (and rapid) developments in modelling distributed neuronal fluctuations (e.g., stochastic, spectral and symmetric DCM for fMRI) – and how this modelling rests upon functional connectivity. This survey concludes by looking at the circumstances under which functional and effective connectivity can be regarded as formally identical. I will try to contextualise these developments in terms of some historical distinctions that have shaped our approaches to connectivity in functional neuroimaging.
Circa 1993 Circa 2013
“Why did you guy’s drop the ball with functional connectivity?” Michael D. Fox, MD, PhD
The past decade has seen tremendous advances in characterising functional integration in the brain; especially in the resting state community. Much of this progress is set against the backdrop of a key dialectic between functional and effective connectivity. I hope to highlight the intimate relationship between functional and effective connectivity and how one informs the other. My talk will focus on the application of dynamic causal modelling to resting state timeseries or endogenous neuronal activity. I will survey recent (and rapid) developments in modelling distributed neuronal fluctuations (e.g., stochastic, spectral and symmetric DCM for fMRI) – and how this modelling rests upon functional connectivity. This survey concludes by looking at the circumstances under which functional and effective connectivity can be regarded as formally identical. I will try to contextualise these developments in terms of some historical distinctions that have shaped our approaches to connectivity in functional neuroimaging.
The forward (dynamic causal) model Endogenous fluctuations Effective connectivity Observed timeseries Functional connectivity
A connectivity reconstruction problem: A degenerate (many-to-one) mapping between effective and functional connectivity
The forward (dynamic causal) model Endogenous fluctuations Effective connectivity Observed timeseries Functional connectivity
Bayesian model inversion Endogenous fluctuations Posterior density Effective connectivity Richard Feynman Log model evidence (Free energy) Observed timeseries Functional connectivity
Bayesian model inversion Endogenous fluctuations Posterior density Bayesian model comparison Log model evidence Bayesian model averaging
Model evidence and Ockham’s principle Bayesian model inversion Posterior density Accuracy Complexity Evidence is afforded by data … fMRI data Log model evidence EEG data EEG models Complexity fMRI models
Bayesian model reduction Armani, Calvin Klein and Versace design houses did not refuse this year to offer very brave and reduced models of the “Thong” and “Tango”. The designers consider that a man with the body of Apollo should not obscure the wonderful parts of his body. And the concept of reduced models This means that we only have to invert the full model to score all reduced models; c.f., the Savage-Dickey density ratio
Log-evidence True and MAP connections 100 0.4 0 0.2 -100 0 -200 log-probability -300 -0.2 -400 -0.4 -500 -0.6 -600 0 5 10 15 0 10 20 30 40 50 60 model Log-evidence Model posterior 100 1 0 0.8 -100 0.6 -200 log-probability probability -300 0.4 -400 0.2 -500 -600 0 0 1 2 3 4 5 6 0 10 20 30 40 50 60 graph size model And recovering (discovering) the true architecture Simulating the response of a four-node network Complexity
vis: responses 2 0 -2 -4 0 200 400 600 800 1000 1200 ag: responses 5 0 -5 0 200 400 600 800 1000 1200 sts: responses 4 2 0 -2 0 200 400 600 800 1000 1200 ppc: responses 2 0 -2 -4 0 200 400 600 800 1000 1200 fef: responses 5 0 -5 0 200 400 600 800 1000 1200 pfc: responses 5 0 -5 0 200 400 600 800 1000 1200 An empirical example (with six nodes) Log- evidence 100 0 -100 log-probability -200 -300 -400 0 0.5 1 1.5 2 2.5 3 3.5 4 x 10 Model posterior Differences in reciprocal connectivity 0.9 0.8 0.7 0.00 0.00-0.57 -0.28 -0.17 -0.31 0.00 0.00-0.340.00-0.37 -0.42 0.57 0.34 0.00-0.45 -0.43 -0.51 0.28 0.00 0.45 0.00 0.00-0.25 0.17 0.37 0.43 0.00 0.00-0.28 0.31 0.42 0.51 0.25 0.28 0.00 'vis' 'sts' 'pfc' 'ppc' 'ag' 'fef' 0.6 0.5 probability 0.4 0.3 0.2 0.1 0 0 0.5 1 1.5 2 2.5 3 3.5 4 model x 10 time {seconds}
The past decade has seen tremendous advances in characterising functional integration in the brain; especially in the resting state community. Much of this progress is set against the backdrop of a key dialectic between functional and effective connectivity. I hope to highlight the intimate relationship between functional and effective connectivity and how one informs the other. My talk will focus on the application of dynamic causal modelling to resting state timeseries or endogenous neuronal activity. I will survey recent (and rapid) developments in modelling distributed neuronal fluctuations (e.g., stochastic, spectral and symmetric DCM for fMRI) – and how this modelling rests upon functional connectivity. This survey concludes by looking at the circumstances under which functional and effective connectivity can be regarded as formally identical. I will try to contextualise these developments in terms of some historical distinctions that have shaped our approaches to connectivity in functional neuroimaging.
The forward (dynamic causal) model Endogenous fluctuations Endogenous fluctuations Deterministic DCM Observed timeseries
The forward (dynamic causal) model Endogenous fluctuations Stochastic DCM Observed timeseries
Simulated responses of a three node network True and MAP connections 0.8 Hidden states Signal and noise 0.6 0.2 1.5 0.4 0.15 1 0.1 0.2 0.5 0.05 0 0 0 -0.05 -0.2 -0.5 -0.1 -1 -0.4 -0.15 -1.5 -0.2 -0.6 50 100 150 200 250 50 100 150 200 250 time time Deterministic DCM -0.8 1 2 3 4 5 6 7 8 9 Extrinsic coupling parameter Hidden causes Network or graph generating data 0.2 0.15 Hidden states True and MAP connections 0.2 0.5 0.1 0.15 0.05 0.1 0 0.05 -0.05 0 0 -0.1 -0.05 -0.15 -0.1 50 100 150 200 250 time -0.15 -0.5 -0.2 1 2 3 4 5 6 7 8 9 50 100 150 200 250 time (bins) Extrinsic coupling parameter Stochastic DCM
The forward (dynamic causal) model Endogenous fluctuations Spectral DCM Observed timeseries
The forward (dynamic causal) model Endogenous fluctuations Spectral DCM
The forward (dynamic causal) model Endogenous fluctuations Spectral DCM Complex cross-spectra
0.4 True and MAP connections Hidden states Endogenous fluctuations Simulated responses of a three node network Prediction and response 0.1 0.4 0.3 0.3 0.6 0.06 0.2 0.05 0.2 0.5 0.04 0.1 0.1 amplitude amplitude 0 0 0.4 0 0.02 -0.1 -0.05 -0.2 0.3 -0.1 imaginary real 0 -0.3 -0.1 0 50 100 150 200 250 300 0 50 100 150 200 250 300 -0.2 0.2 time (seconds) time (seconds) -0.02 -0.3 0.1 -0.4 -0.04 1 2 3 4 5 6 7 8 9 0 -0.1 -0.06 0 50 100 150 200 250 300 0 50 100 150 200 250 300 Hemodynamic response and noise Network or graph generating data Frequency and time (bins) Frequency and time (bins) 0.6 0.4 Region 3 0.2 0.2 -0.3 0 amplitude -0.2 Region 2 -0.4 0.4 -0.2 -0.6 -0.8 0 50 100 150 200 250 300 Region 1 time (seconds)
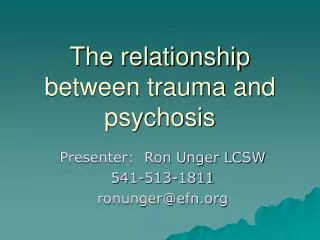
The effect of scan length: True and MAP connections (BPA: 1024 scans) 0.4 0.3 0.2 0.1 0 -0.1 -0.2 -0.3 1 2 3 4 5 6 7 8 9 Root mean square error True and MAP connections (BPA: 256 scans) 0.4 0.35 0.3 0.3 0.2 0.25 0.1 0.2 0 RMS -0.1 0.15 -0.2 0.1 -0.3 1 2 3 4 5 6 7 8 9 0.05 0 128 256 384 512 640 768 896 1024 Session length (scans)
0.35 0.3 0.25 0.2 0.15 0.1 0.05 0 128 256 384 512 640 768 896 1024 Simulations Empirical 1 stochastic Spectral 0.8 0.6 Accuracy 0.4 spectral Posterior expectation (Hz) 0.2 0 Strongest connection -0.2 Comparing spectral and stochastic DCM -0.4 0 5 10 15 20 Subjects 0.35 0.25 0.3 0.2 Stochastic 0.25 0.15 0.2 Posterior expectation (Hz) Accuracy 0.15 0.1 0.1 0.05 0.05 0 128 256 384 512 640 768 896 1024 0 Session length (scans) 0 5 10 15 20 Subjects
Dynamic causal model Convolution kernel representation Functional Taylor expansion Spectral representation Convolution theorem Autoregressive representation Yule Walker equations Spectral representation Convolution theorem Cross-covariance Auto-regression coefficients Cross-spectral density Directed transfer functions Cross-correlation Coherence Auto-correlation Granger causality Second-order data features (functional connectivity)
The past decade has seen tremendous advances in characterising functional integration in the brain; especially in the resting state community. Much of this progress is set against the backdrop of a key dialectic between functional and effective connectivity. I hope to highlight the intimate relationship between functional and effective connectivity and how one informs the other. My talk will focus on the application of dynamic causal modelling to resting state timeseries or endogenous neuronal activity. I will survey recent (and rapid) developments in modelling distributed neuronal fluctuations (e.g., stochastic, spectral and symmetric DCM for fMRI) – and how this modelling rests upon functional connectivity. This survey concludes by looking at the circumstances under which functional and effective connectivity can be regarded as formally identical. I will try to contextualise these developments in terms of some historical distinctions that have shaped our approaches to connectivity in functional neuroimaging.
The forward (dynamic causal) model Endogenous fluctuations What if the connectivity was symmetrical? Symmetrical DCM
The forward (dynamic causal) model Endogenous fluctuations Symmetrical DCM
The forward (dynamic causal) model Endogenous fluctuations Symmetrical DCM In the absence of measurement noise, effective connectivity becomes the negative inverse functional connectivity
vis: responses 2 0 -2 -4 0 200 400 600 800 1000 1200 ag: responses 5 0 -5 0 200 400 600 800 1000 1200 sts: responses 4 2 0 -2 0 200 400 600 800 1000 1200 ppc: responses 2 0 -2 -4 0 200 400 600 800 1000 1200 fef: responses 5 0 -5 0 200 400 600 800 1000 1200 pfc: responses 5 0 -5 0 200 400 600 800 1000 1200 The number of slow (unstable) modes and their time constants Embedding (empirical) 70 60 50 40 Free energy 30 20 10 0 1 2 3 4 5 Embedding dimension time {seconds}
The forward (dynamic causal) model Endogenous fluctuations Breaking the symmetry: Large DCMs
The forward (dynamic causal) model Log evidence Accuracy Complexity Principal modes in the language system Number of modes (m)
Nature uses only the longest threads to weave her patterns, so each small piece of her fabric reveals the organization of the entire tapestry. • chapter 1, “The Law of Gravitation,” p. 34 Richard Feynman
Thank you And thanks to Bharat Biswal Christian Büchel CC Chen Jean Daunizeau Olivier David Marta Garrido Sarah Gregory Lee Harrison Joshua Kahan Stefan Kiebel Baojuan Li Andre Marreiros Rosalyn Moran Hae-Jeong Park Will Penny Adeel Razi Mohamed Seghier Klaas Stephan And many others