Download
1 / 13
130 likes | 293 Views
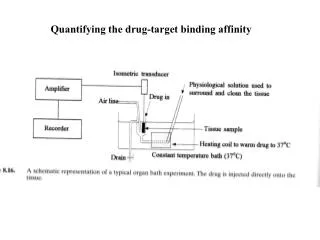
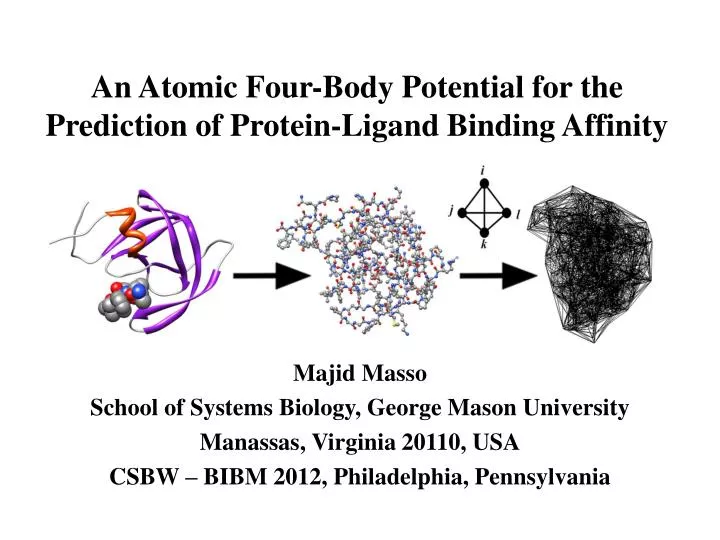
An Atomic Four-Body Potential for the Prediction of Protein-Ligand Binding Affinity. Majid Masso School of Systems Biology, George Mason University Manassas, Virginia 20110, USA CSBW – BIBM 2012, Philadelphia, Pennsylvania. Knowledge-Based Potentials of Mean Force.

E N D
An Atomic Four-Body Potential for the Prediction of Protein-Ligand Binding Affinity Majid Masso School of Systems Biology, George Mason University Manassas, Virginia 20110, USA CSBW – BIBM 2012, Philadelphia, Pennsylvania
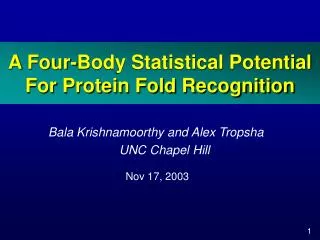
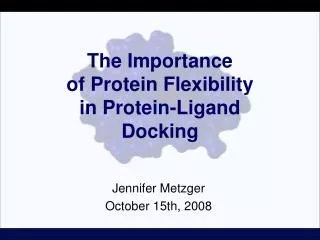
Knowledge-Based Potentials of Mean Force • Generated via statistical analysis of observed features in a diverse training set of structures selected from the PDB • Alternative to physics or molecular mechanics energy functions • Assumption: observed features follow a Boltzmann distribution • Examples: • Well-documented in the literature: distance-dependent pairwise interactions at the atomic or amino acid level • This study: inclusion of higher-order contributions by developing an all-atom four-body statistical potential • Motivation (our prior work): • Four-body protein potential at the amino acid level
Motivational Example:Pairwise Amino Acid Potential • The 20-letter protein alphabet yields 210 residue pairs • Obtain a diverse PDB training set of single protein chains; represent each protein as a set of amino acid points in 3D • For each residue pair (i, j), calculate the relative frequency fij with which they appear within a given distance (e.g., 12 angstroms) of each other in all the protein structures • Calculate a rate pij expected by chance alone by using a background or reference distribution (more later…) • Apply inverted Bolzmann principle: sij = log(fij / pij) quantifies interaction propensity and is proportional to the energy of interaction (by a factor of ‘–RT’) for the pair
All-Atom Four-Body Statistical Potential • Diverse PDB training set of 1417 single chain and multimeric proteins, many complexed to ligands (see paper for text file) • Six-letter atomic alphabet: C, N, O, S, M (metals), X (other) • Apply Delaunay tessellation to the atomic point coordinates of each PDB file – objectively identifies all nearest-neighbor quadruplets of atoms in the structure (8 angstrom cutoff)
All-Atom Four-Body Statistical Potential • The six-letter atomic alphabet yields 126 distinct quadruplets • Calculate observed rate fijklof quad (i, j, k, l) occurrence among all tetrahedra from the 1417 structure tessellations • Compute rate pijkl expected by chance from a multinomial reference distribution: • an = proportion of atoms from all structures that are of type n • tn = number of occurrences of atom type n in the quad
Summary Data for the 1417 Structure Files and their Delaunay Tessellations
Topological Score (TS) • Delaunay tessellation of any macromolecular structure yields an aggregate of tetrahedral simplices • Each simplex can be scored using the all-atom four-body potential based on the quad present at the four vertices • Topological score (or ‘total potential’) of the structure: sum the scores of all constituent simplices in tessellation sijkl TS = Σsijkl
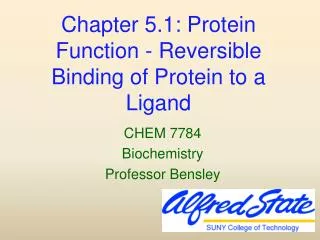
Application of ΔTS: Predicting Protein – Ligand Binding Energy • MOAD – repository of exp. dissociation constants (kd) for protein–ligand complexes whose structures are in PDB • Collected kd values for 300 complexes reflecting diverse protein structures • Obtained exp. binding energy from kd via ΔGexp= –RTln(kd) • Calculated ΔTS for complexes
Predicting Protein – Ligand Binding Energy • Randomly selected 200 complexes to train a model • Correlation coefficient r = 0.79 between ΔTS and ΔGexp • Empirical linear transformation of ΔTS to reflect energy values: ΔGcalc = L (ΔTS) • Linear => same r = 0.79value between ΔGcalc and ΔGexp • Also, standard error of SE = 1.98 kcal/mol and fitted regression line of y = 1.18x (y = ΔGcalc and x = ΔGexp)
Predicting Protein – Ligand Binding Energy • For the test set of 100 remaining complexes: • r = 0.79 between ΔGcalc and ΔGexp • SE = 1.93 kcal/mol • Fitted regression line is y = 1.11x – 0.63 • All training/test data is available online as a text file (see paper)
References and Acknowledgments • PDB (structure DB): http://www.rcsb.org/pdb • MOAD (ligand binding DB): http://bindingmoad.org/ • Qhull (Delaunay tessellation): http://www.qhull.org/ • UCSF Chimera (ribbon/ball-stick structure visualization): http://www.cgl.ucsf.edu/chimera/ • Matlab (tessellation visualization): http://www.mathworks.com/products/matlab/