Download
1 / 22
220 likes | 399 Views
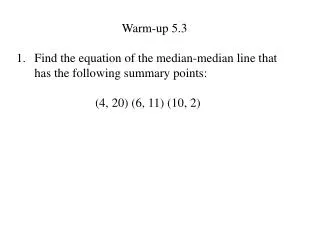
Warm-up 5.3 Find the equation of the median-median line that has the following summary points: (4, 20) (6, 11) (10, 2). Warm-up 5.3 Answers Find the equation of the median-median line that has the following summary points: (4, 20) (6, 11) (10, 2)

E N D
Warm-up 5.3 Find the equation of the median-median line that has the following summary points: (4, 20) (6, 11) (10, 2)
Warm-up 5.3 Answers Find the equation of the median-median line that has the following summary points: (4, 20) (6, 11) (10, 2) y – 20 = -3(x – 4) y – 20 = -3x + 12 y = -3x + 32 y = -3(6) + 32 = 14 ⅓(11 – 14) = -1 y = -3x + 32 – 1 y = -3x + 31
Data AnalysisSection 5.3 Standard: MM2D1d and MM2D2d Essential Question: How do I use the normal curve to relate to standard deviations? What issues arise when using data to explore the relationship between two variables?
Vocabulary • Normal distribution: A probability distribution modeled by a bell-shaped curve that is symmetric about the mean. • Normal curve: the bell-shaped curve that models a normal distribution • Standard normal distribution: the normal distribution with mean 0 and standard deviation 1
As we learned in lesson 6.3, finding the mean of a data set tells you ________________ and finding the standard deviation gives you ___________________________. This can be represented visually by a normal curve. where the center is an idea of the spread of the data
A normal distribution with mean and standard deviation σ has these properties: • About ______of the data lies within 1 standard deviation of the mean. • About ______ of the data lies within 2 standard deviations of the mean. • About ______ of the data lies within 3 standard deviations of the mean. 68% 95% 99.7%
Ex. 1 A normal distribution has mean and standard deviation σ. For a randomly selected x-value from the distribution, find Solution: the probability that a randomly selected x-value lies between ___________ and ____________ is the shaded area under the normal curve. Therefore: 13.5% 81.5% 34% 34%
2. A normal distribution has mean and standard deviation σ. For a randomly selected x-value from the distribution, find . = 0.15% + 2.35% + 13.5% = 16%
Interpret normally distributed data 3.The math scores of an exam for the state of Georgia are normally distributed with a mean of 496 and a standard deviation of 109. About what percent of the test-takers received scores between 387 and 605? (Use the diagram on your handout.) P(387 ≤ x ≤ 605) = 34% + 34% = 68% 169 278 387 496 605 714 823
4. The heights (in feet) of fully grown white oak trees are normally distributed with a mean of 90 feet and a standard deviation of 3.5 feet. Using the diagram for white oak trees, answer the following: About what percent of white oak trees have heights less than 97 feet? 79.5 83 86.5 90 93.5 97 100.5 = 100% - 0.15% - 2.35% = 97.5%
b. About what percent of white oak trees have heights between 83 feet and 90 feet? c. About what percent of white oak trees have heights between 86.5 and 100.5 feet? 79.5 83 86.5 90 93.5 97 100.5
Vocabulary Population: group of people or objects that you want information about Sample: a subset of the population being studied Unbiased sample: representative of the population you want information about Biased sample: an overrepresentation or underrepresentation of the population Population mean: the true mean of the entire population Margin of error: a limit on how much the responses of the sample would differ from the responses of the population
A student wants to survey everyone at his school about the quality of the school’s assemblies. Identify the type of sample described as a self-selected sample, a systematic sample, a convenience sample, or a random sample. Tell whether the sample is biased or unbiased. Explain your reasoning. Self-selected: members of a population can volunteer to be in the sample Systematic: a rule is used to select members of a population, such as selecting every other person Convenience: easy-to-reach members of a population are selected
Random: each member of a population has an equal change of being selected 5. The student surveys every 8th student that enters the assembly. systematic sample biased (no teachers)
6. From a random name lottery, the student chooses 125 student and teachers to survey. random sample unbiased 7. A local mayor wants to survey local area registered voters. She mails surveys to the individuals that are members of her political party and uses only the surveys that are returned. self-selected sample biased (1 political party)
Margin of Error Formula: When a random sample of size n is taken from a large population, the margin of error is approximated by: Margin of error: = _______________ This means that if the percent of the sample responding a certain way is p (expressed as a decimal), then the percent of the population that would respond the same way is likely to be between p - ________ and p + ________.
8. In a survey of 325 students and teachers, 30% said they read the school’s newspaper every weekday. (a). What is the margin of error for the survey? (b). Give an interval that is likely to contain the exact percent of all students and teachers who read the school’s newspaper every weekday. between 24.5% and 35.5% (c). Suppose the sample size is 400 students and teachers. What is the margin of error for the survey?
9. On your unit 5 project you surveyed 50 people. The enrollment this year at Richmond Hill High School is 1539. (a). What is the margin of error for your survey? (b). How many people would we have to survey if we wanted a margin of error of 5%? 5% = 0.05
When two variables in a relationship are correlated, a change in one variable suggests a change in the other. However, correlation does not always imply causation. In other words, just because a change in variable x suggests a change in variable y, the change in x does not necessary cause the change in y. Both the change in x and the change in y could be caused by a third factor.
10. (a) A study has shown the as the number of hours a person spends dancing increases, the probability that the person will experience hearing loss also increases. Because there is an obvious correlation between hours spent dancing and probability of hearing loss, the study concluded that dancing causes hearing loss. Is it likely that the study’s conclusion is correct? (b). What else could have caused both an increase in the number of hours spent dancing and an increase in the probability of hearing loss? loud music (c). Is the relationship between variables likely one of causation or correlation? correlation Therefore, conclusion is incorrect.
11. a. Give an example of a variable that could be in correlation with the amount of hot cocoa a person consumes. The more hot cocoa a person consumes, the more likely that person is to experience frostbite. b. Explain whether or not this is an example of causation. Drinking hot cocoa probably doesn’t cause frostbite. However, cold whether can cause both an increase in hot cocoa consumption and frostbite. Therefore, the correlation between hot cocoa consumed and frostbite is NOT an example of causation.
Decide if each of the following relationships is likely one of causation, or is it only a correlation. 12. As a person’s corrected vision improves, his reading ability improves. causation 13. The more umbrellas are in use, the greener the grass becomes. correlation 14. The more skiers on the slopes, the more school days are cancelled. correlation 15. The more a person types, the more likely the person is to experience carpal tunnel syndrome. causation